Fig. 10.
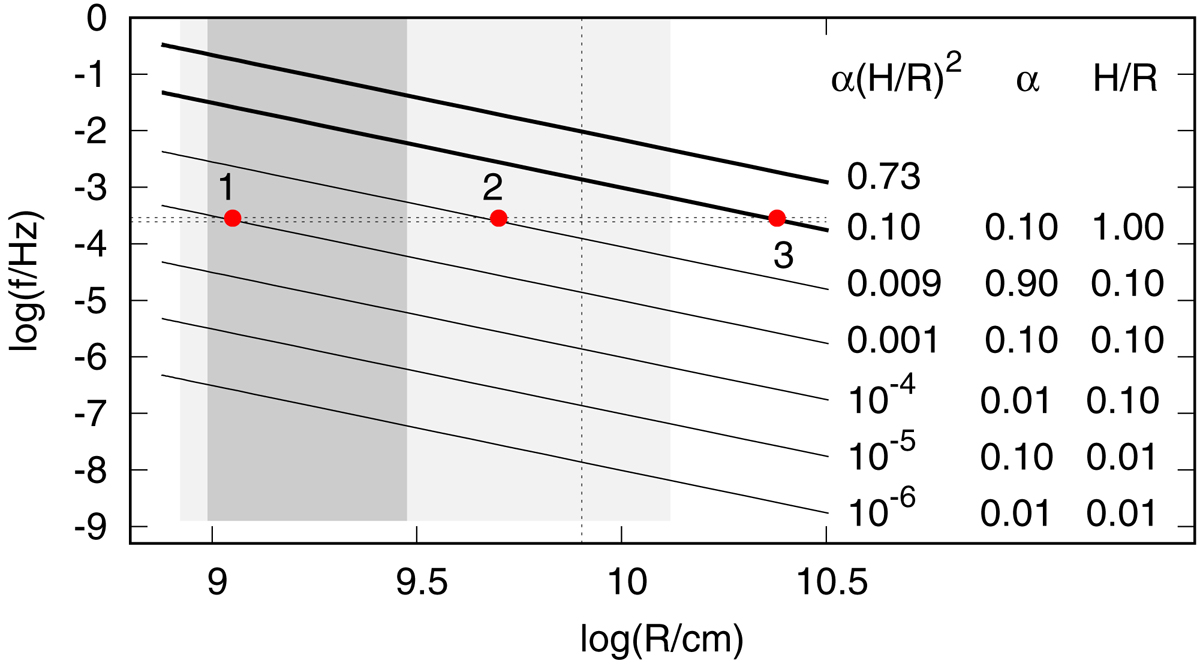
Frequencies corresponding to viscous timescale compared to the two lowest measured frequencies from Fig. 1 (two horizontal dotted lines). Various models with different parameters listed as labels are shown. The vertical dotted line is the corona radius from Scaringi (2014). The shaded areas are the inner disk radius intervals from Fig. 4 of Scaringi et al. (2017). Labeled points are solutions showing the measured frequencies.
Current usage metrics show cumulative count of Article Views (full-text article views including HTML views, PDF and ePub downloads, according to the available data) and Abstracts Views on Vision4Press platform.
Data correspond to usage on the plateform after 2015. The current usage metrics is available 48-96 hours after online publication and is updated daily on week days.
Initial download of the metrics may take a while.