Fig. 1.
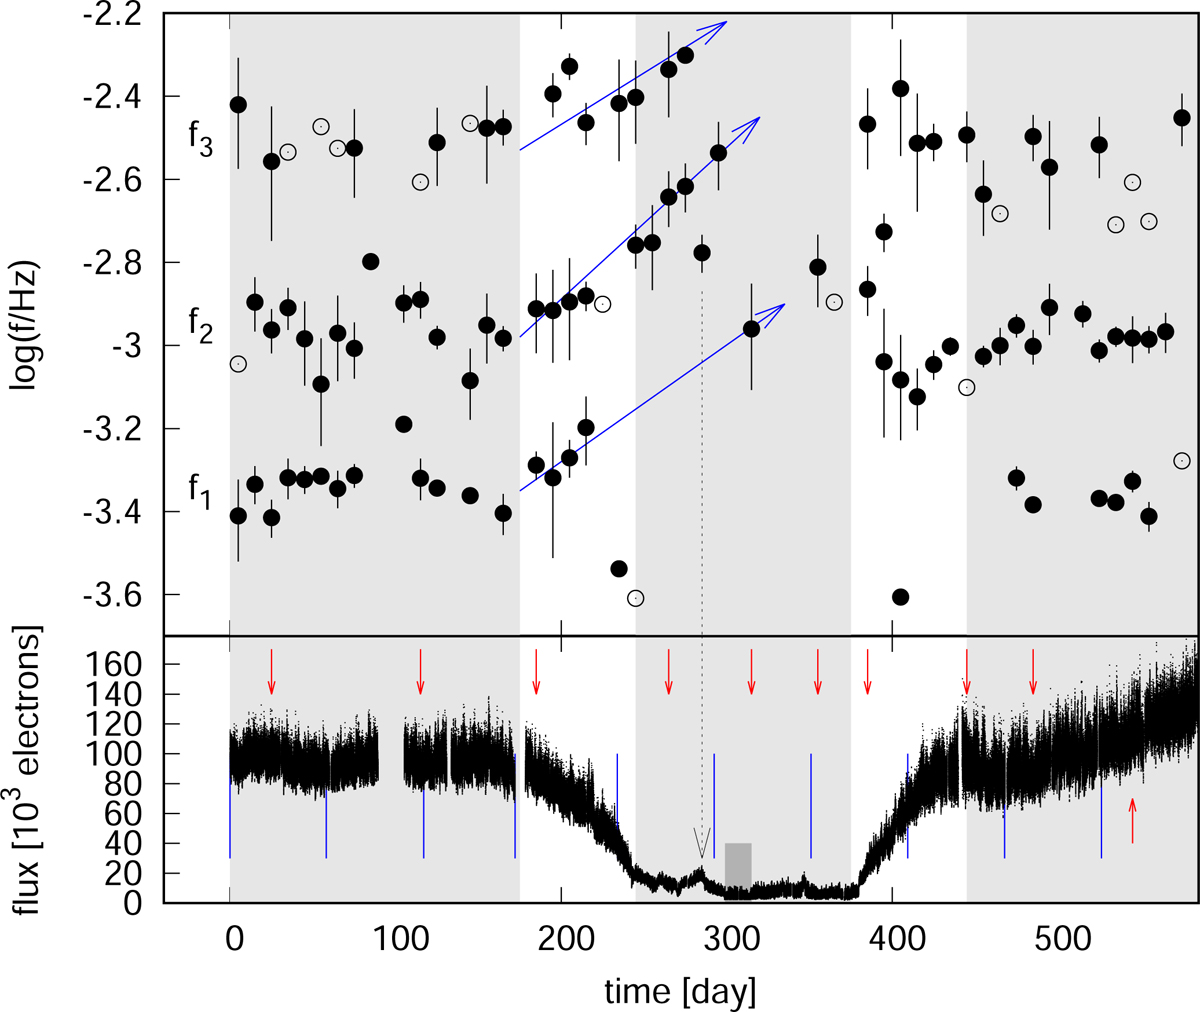
Upper panel: time evolution of PDS components derived using Lorentzians in Eq. (1). The characteristic frequencies fi (marked as labels on the left side) are shown by the black circles with error bars (δlog(fi)) for significantly detected components with δlog(fi) < 0.2, and by black circles without error bars for less significantly detected ones with 0.2 < δlog(fi) < 0.5. The light shaded areas show time intervals selected as before, during and after the low state. Blue arrows outline possible frequency evolution, and the dashed vertical black arrow shows the connection of one deviated point with local re-brightening (see text for details). Lower panel: analyzed light curve for comparison. The red arrows show the (middle) time location of the PDS examples in Fig. 4. The dark shaded area is the deep low state identified by Scaringi et al. (2017) (see Sect. 4 for details). The vertical blue lines divide the light curve into ten equally spaced subsamples for the shot profile calculation in Sect. 4.
Current usage metrics show cumulative count of Article Views (full-text article views including HTML views, PDF and ePub downloads, according to the available data) and Abstracts Views on Vision4Press platform.
Data correspond to usage on the plateform after 2015. The current usage metrics is available 48-96 hours after online publication and is updated daily on week days.
Initial download of the metrics may take a while.