Fig. 9.
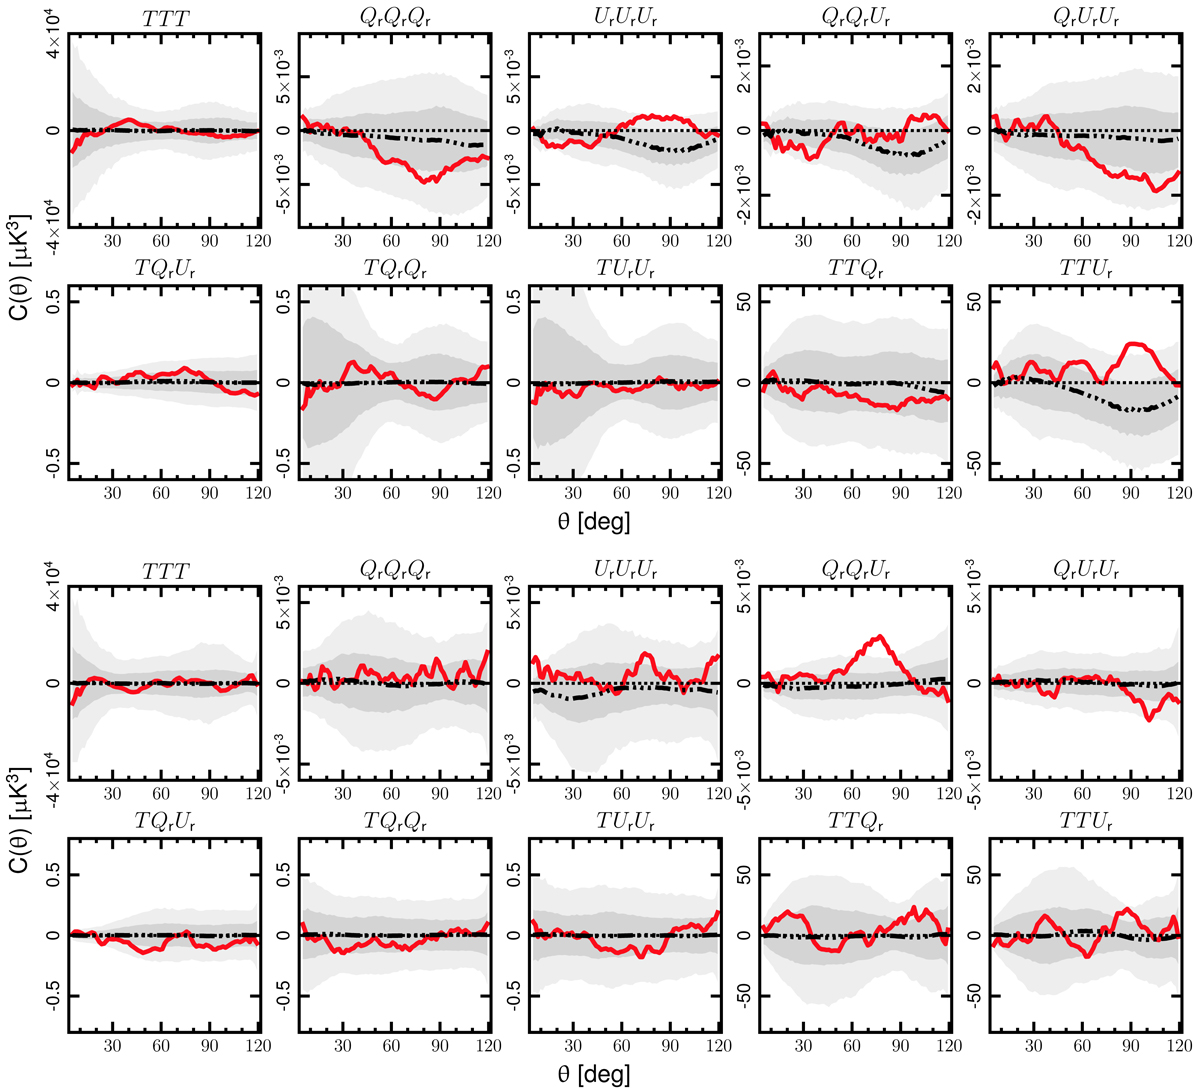
3-point correlation functions determined from the Nside = 64 Planck CMB Commander 2018 temperature and polarization maps. Results are shown for the pseudo-collapsed 3-point (upper panel) and equilateral 3-point (lower panel) functions. The red solid line corresponds to the data, while the black three dots-dashed line indicates the mean determined from the FFP10 Commander simulations, and the shaded dark and light grey regions indicate the corresponding 68% and 95% confidence areas, respectively. See Sect. 5.2 for the definition of the separation angle θ.
Current usage metrics show cumulative count of Article Views (full-text article views including HTML views, PDF and ePub downloads, according to the available data) and Abstracts Views on Vision4Press platform.
Data correspond to usage on the plateform after 2015. The current usage metrics is available 48-96 hours after online publication and is updated daily on week days.
Initial download of the metrics may take a while.