Fig. A.6.
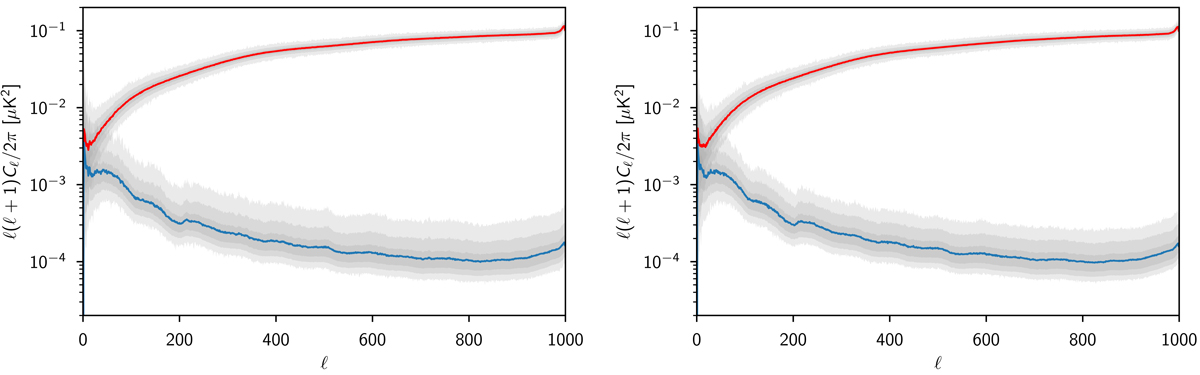
Pseudo-Cℓ spectra of residuals for E and B modes (left and right columns, respectively) determined from the purified inpainting of the FFP10 simulations for all four component-separation methods. Solid curves show averaged spectra, with red corresponding to the residual masked with the reconstruction mask and blue corresponding to the residual masked with the confidence mask. Semi-transparent areas filled with grey show 68%, 95%, and minimum-to-maximum bounds for individual realizations.
Current usage metrics show cumulative count of Article Views (full-text article views including HTML views, PDF and ePub downloads, according to the available data) and Abstracts Views on Vision4Press platform.
Data correspond to usage on the plateform after 2015. The current usage metrics is available 48-96 hours after online publication and is updated daily on week days.
Initial download of the metrics may take a while.