Fig. A.3.
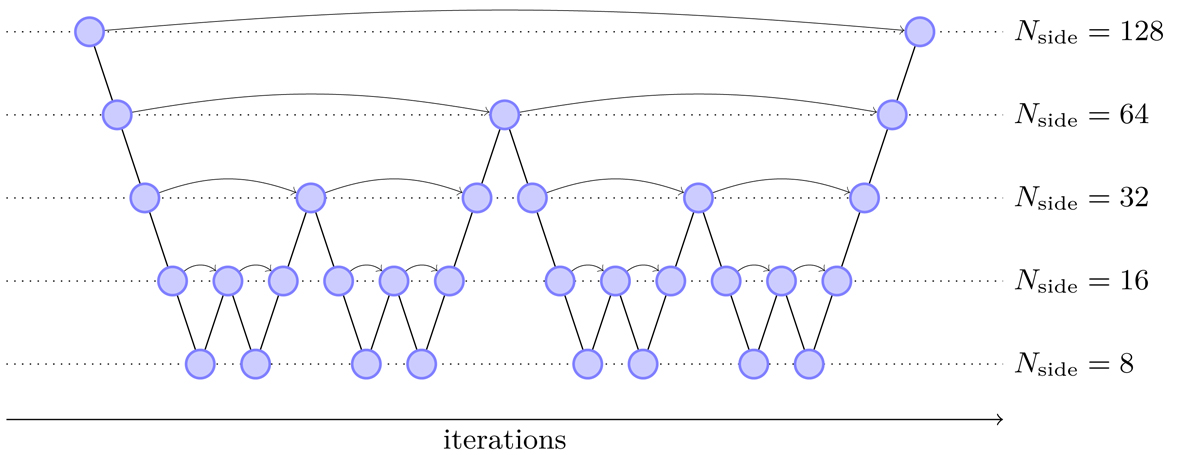
Multigrid inpainting schedule for an Nside = 128 map. Filled nodes represent successive iterations of diffusion steps (Eq. (A.17)), downward strokes represent calculation of the residual (Eq. (A.19)) and its downgrade to the coarser grid, while upward strokes represent the upgrade of the correction (Eq. (A.20)) to the finer grid, and solid arrows represent the merge of the correction into the solution (Eq. (A.21)). Eight diffusion steps are used at all grid levels except the lowest, where 64 steps are used, which is enough to find the static solution there.
Current usage metrics show cumulative count of Article Views (full-text article views including HTML views, PDF and ePub downloads, according to the available data) and Abstracts Views on Vision4Press platform.
Data correspond to usage on the plateform after 2015. The current usage metrics is available 48-96 hours after online publication and is updated daily on week days.
Initial download of the metrics may take a while.