Fig. 40.
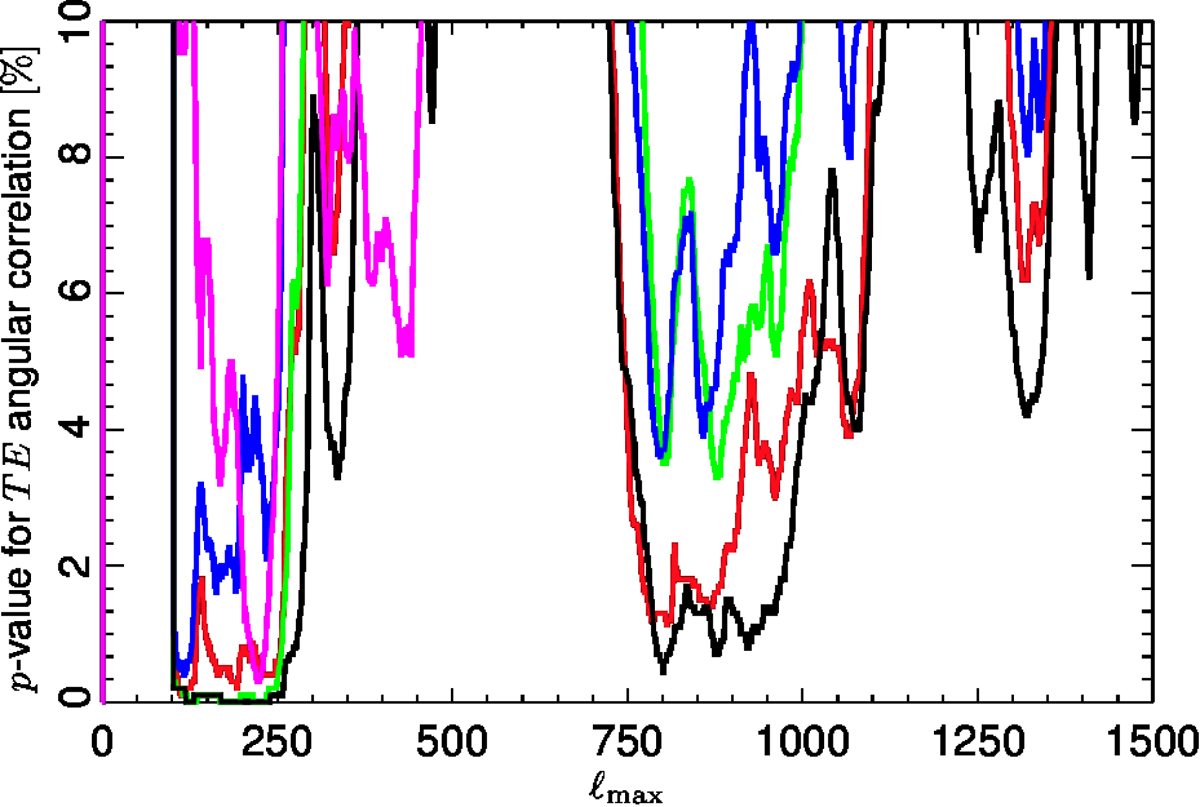
Derived p-values for the angular correlation of TT and EE dipole directions in Commander maps as a function of ℓmax, determined using the HM split with the full-mission common mask (black), the HM split with the HM common mask (green), the OE map with the full-mission common mask (red), and the OE map with the OE common mask (blue), based on FFP10 simulations. The magenta line shows the corresponding correlation between TE and EE directions for the Commander HM split with the common mask. The p-values are based on the fraction of simulations with a higher RS, determined over the ℓ range up to the given ℓmax, compared to the data, hence small p-values would correspond to anomalously aligned dipole directions. The results shown here have been marginalized over bin sizes in the range Δℓ = 8 to Δℓ = 32.
Current usage metrics show cumulative count of Article Views (full-text article views including HTML views, PDF and ePub downloads, according to the available data) and Abstracts Views on Vision4Press platform.
Data correspond to usage on the plateform after 2015. The current usage metrics is available 48-96 hours after online publication and is updated daily on week days.
Initial download of the metrics may take a while.