Fig. 39.
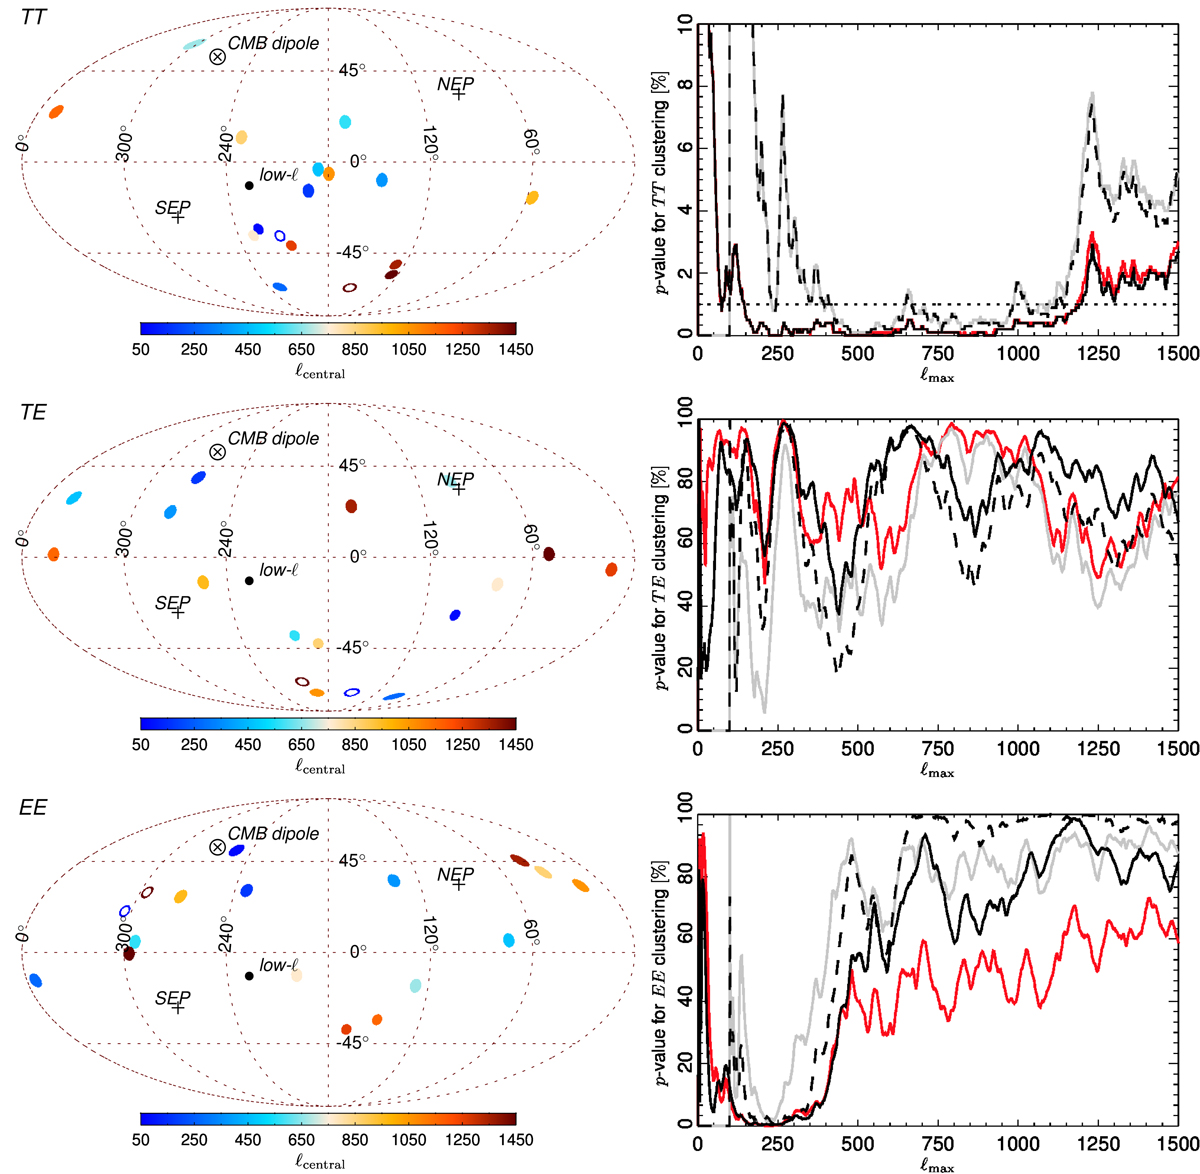
Left panels: as for Fig. 36, but for the Commander OE maps with the full-mission common mask applied. The mean error on the derived direction that results from masking the data is 39° in the range ℓ < 800 and 50° in the range ℓ > 800 for temperature, but 78° in the range ℓ < 800 and 91° in the range ℓ > 800 for EE polarization. Right panels: derived p-values for the angular clustering of the power distribution in OE maps as a function of ℓmax, determined for Commander (red line) based on simulations with the full-mission common mask applied. The grey line shows the Commander results when excluding the first 100 multipoles in the analysis, the black solid line shows results for the Commander HM split, and the black dashed line corresponds to the grey line for the Commander HM split, in all cases with the common mask applied.
Current usage metrics show cumulative count of Article Views (full-text article views including HTML views, PDF and ePub downloads, according to the available data) and Abstracts Views on Vision4Press platform.
Data correspond to usage on the plateform after 2015. The current usage metrics is available 48-96 hours after online publication and is updated daily on week days.
Initial download of the metrics may take a while.