Fig. 38.
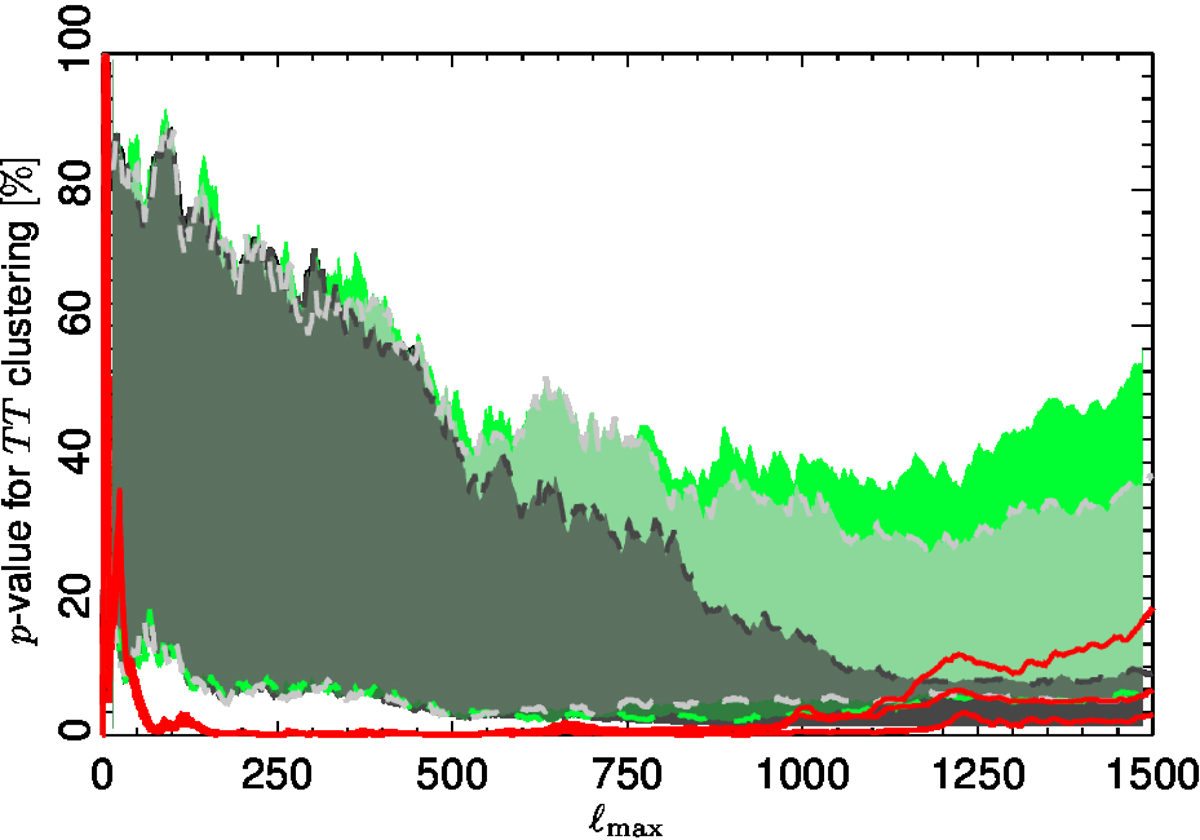
Modulation results at high ℓ. The shaded bands show the 68% spread of p-values for asymmetry taken from Commander simulations with a mean p-value less than 10% for ℓ > 1000. The dark green band (dark green boundaries) represents results computed from the OE data set using the full-mission common mask, the grey band (with grey boundaries) to the same data set analysed with the OE common mask applied, and the light green band (with light green boundaries) corresponds to the HM data set analysed using the HM common mask. The red solid lines show the same three cases for the data: lower line, full-mission common mask; middle line, OE common mask; and upper line, HM common mask.
Current usage metrics show cumulative count of Article Views (full-text article views including HTML views, PDF and ePub downloads, according to the available data) and Abstracts Views on Vision4Press platform.
Data correspond to usage on the plateform after 2015. The current usage metrics is available 48-96 hours after online publication and is updated daily on week days.
Initial download of the metrics may take a while.