Fig. 36.
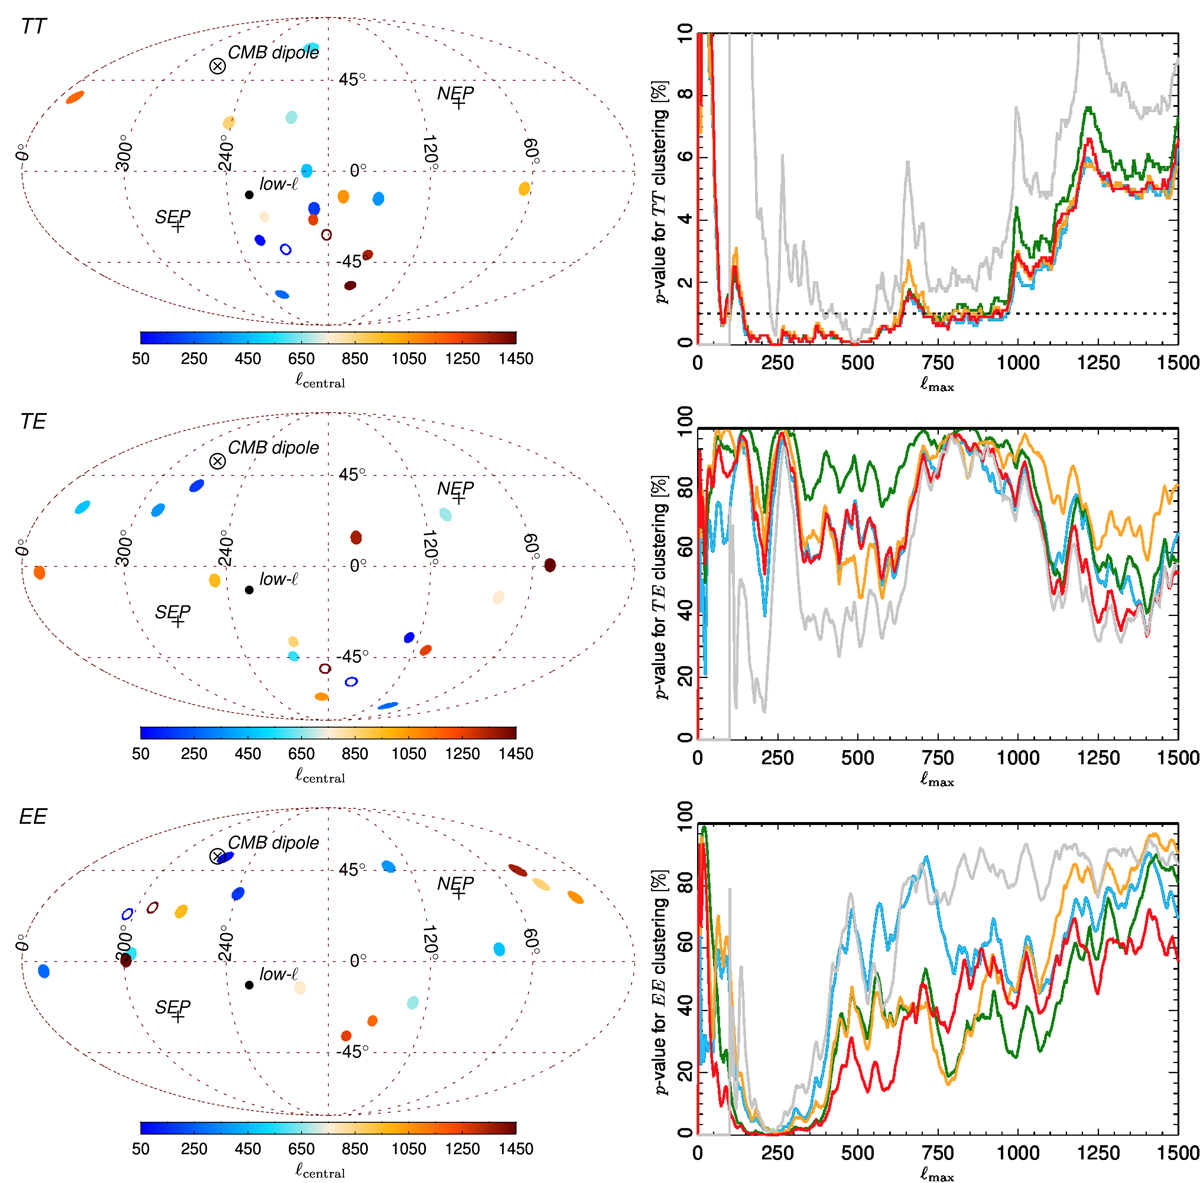
Left panels: dipole directions for independent 100-multipole bins of the local power-spectrum distribution from ℓ = 2 to 1500 in the Commander OE maps, with the OE common mask applied. The preferred directions for maps of specific multipole bins are colour coded according to the central value of the bin, ℓcentral, as shown in the colour bar. Note that the maps have been rotated about the Galactic north-south axis, so that Galactic longitude l = 180° is in the centre of the map. The top panel shows the directions for the TT power spectrum, the middle panel for the TE power spectrum and the bottom panel for the EE power spectrum. In all panels, we also show the CMB dipole direction, the north ecliptic pole (NEP), the south ecliptic pole (SEP), and the preferred dipolar modulation axis (labelled as “low-ℓ”) derived from the temperature data in Sect. 7.2. The average directions determined from the two multipole ranges ℓ = 2 − 300 and ℓ = 750 − 1500 are shown as blue and dark red (open) rings, respectively. The mean error on the derived directions that results from masking the data is 44° in the range ℓ < 800 and 62° in the range ℓ > 800 for temperature, but 78° in the range ℓ < 800 and 91° in the range ℓ > 800 for EE polarization. Right panels: derived p-values for the angular clustering of the power distribution in OE maps as a function of ℓmax, determined for Commander (red), NILC (orange), SEVEM (green), and SMICA (blue), based on FFP10 simulations using the OE common mask. These are the same colours used throughout the paper (e.g., see Fig. 5), while the grey line shows the Commander results when excluding the first 100 multipoles in the analysis. These p-values are based on the fraction of simulations with a higher RS, determined over the ℓ range up to the given ℓmax, compared to the data, hence small p-values would correspond to anomalously aligned dipole directions. The results shown here have been marginalized over bin sizes in the range Δℓ = 8 to Δℓ = 32.
Current usage metrics show cumulative count of Article Views (full-text article views including HTML views, PDF and ePub downloads, according to the available data) and Abstracts Views on Vision4Press platform.
Data correspond to usage on the plateform after 2015. The current usage metrics is available 48-96 hours after online publication and is updated daily on week days.
Initial download of the metrics may take a while.