Fig. 31.
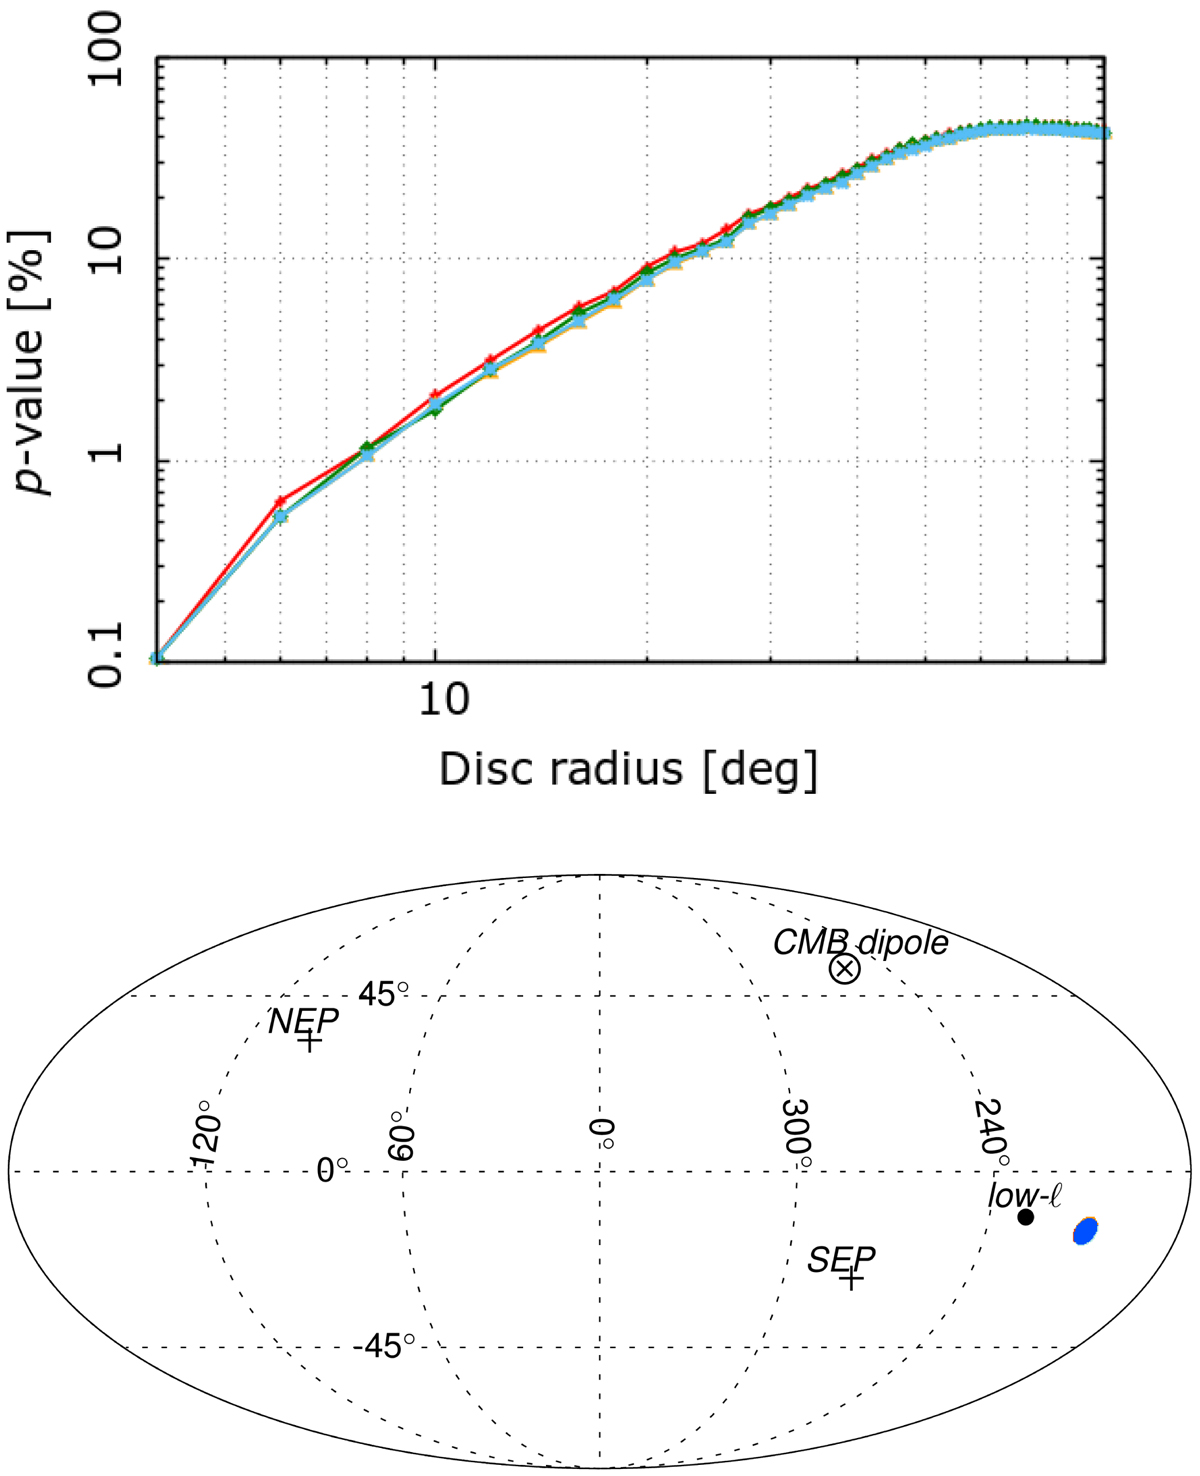
Upper panel: p-values for variance asymmetry measured as the fraction of simulations with local-variance dipole amplitudes larger than those inferred from the data, for low-resolution (Nside = 64) temperature maps. The p-values are given as a function of disc radius and for the four component-separated temperature maps, Commander (red), NILC (orange), SEVEM (green), and SMICA (blue). Lower panel: corresponding local-variance dipole directions for the four component-separation temperature maps, and for 4° discs with the lowest p-values. Note that the four directions match almost perfectly, so that the symbols essentially overlap. For reference, we also show the CMB dipole direction, the north ecliptic pole (NEP), the south ecliptic pole (SEP), and the preferred dipolar modulation axis (labelled as “low-ℓ”) derived from the temperature data in Sect. 7.2.
Current usage metrics show cumulative count of Article Views (full-text article views including HTML views, PDF and ePub downloads, according to the available data) and Abstracts Views on Vision4Press platform.
Data correspond to usage on the plateform after 2015. The current usage metrics is available 48-96 hours after online publication and is updated daily on week days.
Initial download of the metrics may take a while.