Fig. 28.
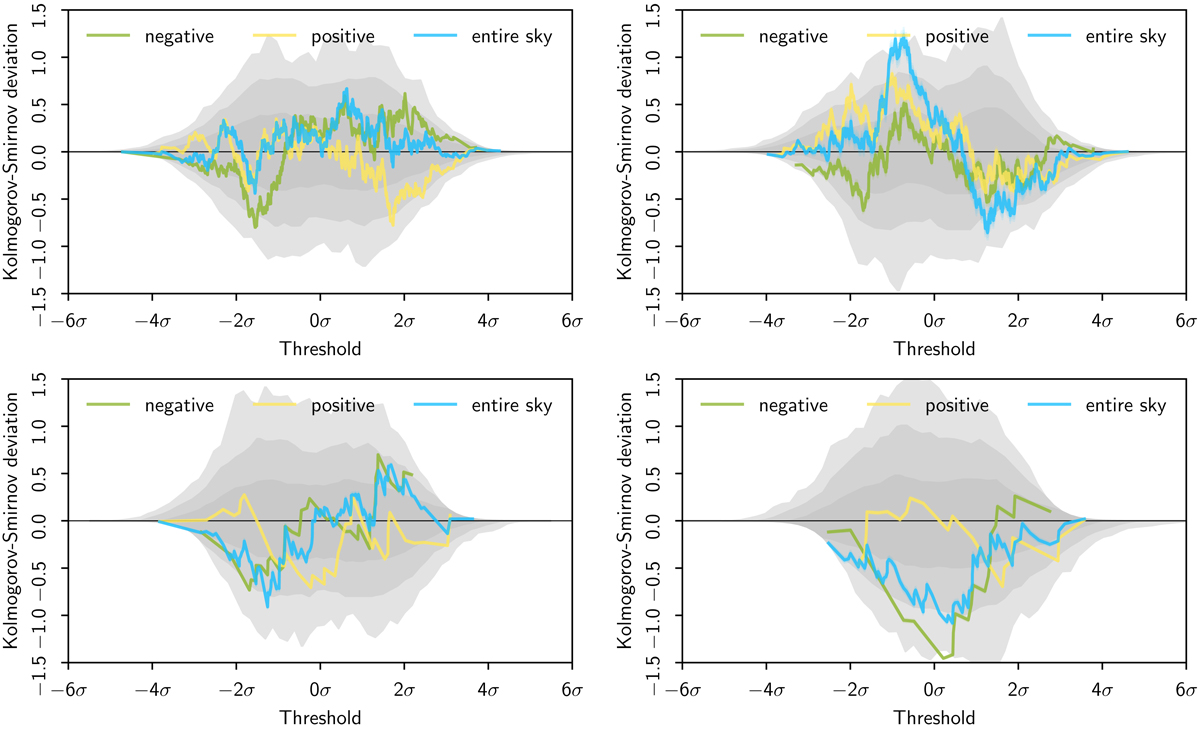
Kolmogorov–Smirnov deviation of the peak distribution for the SMICA temperature T (left) and the reconstructed E-mode polarization (right) maps in 70° radius discs centred on the positive and negative asymmetry directions as determined by the SMICATT, TE, EE QML estimator in Sect. 7.2. Top panels: maps filtered with GAUSS kernels of 120′ and bottom panels: filtering with 600′ FWHM.
Current usage metrics show cumulative count of Article Views (full-text article views including HTML views, PDF and ePub downloads, according to the available data) and Abstracts Views on Vision4Press platform.
Data correspond to usage on the plateform after 2015. The current usage metrics is available 48-96 hours after online publication and is updated daily on week days.
Initial download of the metrics may take a while.