Fig. 27.
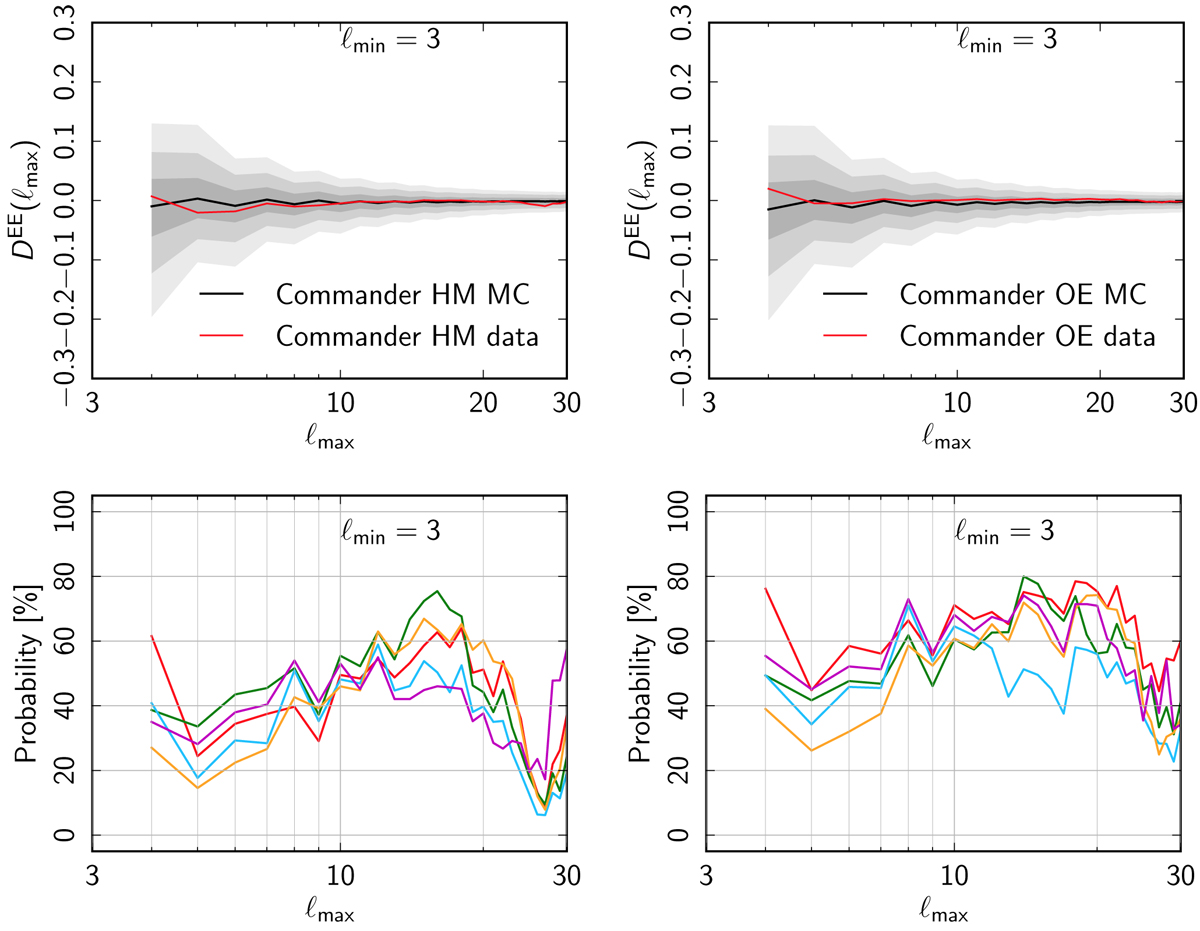
Upper panels: DEE(ℓmax) for the Commander HM (left panel) and OE (right panel) data. The shaded grey regions indicate the distribution of the statistic derived from the corresponding MC simulations as in Fig. 25. Lower panels: lower-tail probability of the polarization estimators as a function of ℓmax, as described in Fig. 26. For these lower panels small probabilities would correspond to anomalously odd parity.
Current usage metrics show cumulative count of Article Views (full-text article views including HTML views, PDF and ePub downloads, according to the available data) and Abstracts Views on Vision4Press platform.
Data correspond to usage on the plateform after 2015. The current usage metrics is available 48-96 hours after online publication and is updated daily on week days.
Initial download of the metrics may take a while.