Fig. 25.
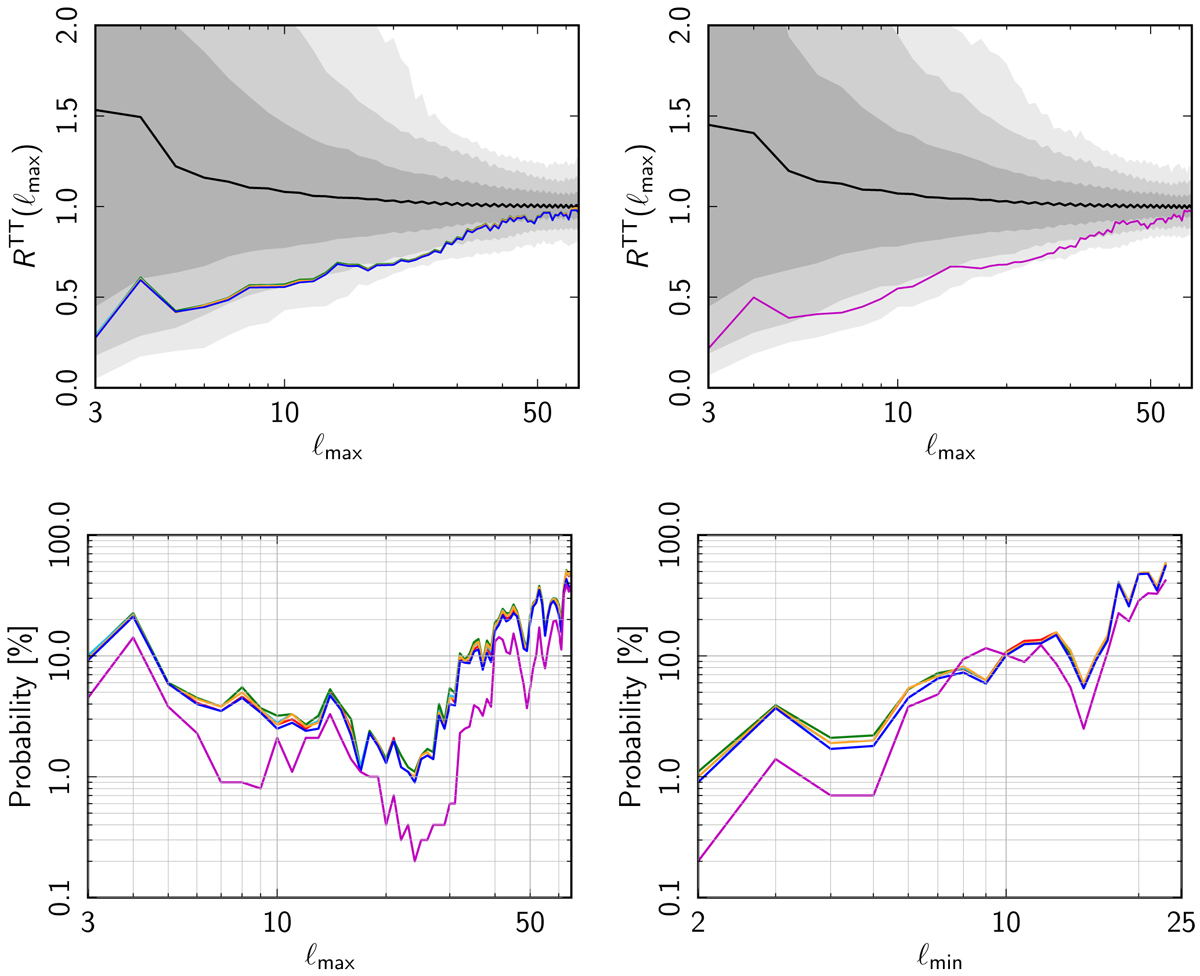
Upper panels: ratio RTT(ℓmax) of the Planck 2018 data determined at Nside = 32. The shaded grey regions indicate the distribution of the statistic derived from the SMICA MC simulations, with the dark, lighter, and light grey bands corresponding to the 1, 2, and 3σ confidence levels, respectively. Left panel: ratio computed from the component-separated maps, Commander (red), NILC (orange), SEVEM (green), and SMICA (cyan), after application of the common mask. Note that these results substantially overlap each other. Right panel: ratio computed when the Lkl-Commander map (magenta) is analysed with the corresponding mask. Lower panels: lower-tail probability estimator as a function of ℓmax (left), and ℓmin with a fixed ℓmax = 24 (right). For these lower panels small probabilities would correspond to anomalously odd parity.
Current usage metrics show cumulative count of Article Views (full-text article views including HTML views, PDF and ePub downloads, according to the available data) and Abstracts Views on Vision4Press platform.
Data correspond to usage on the plateform after 2015. The current usage metrics is available 48-96 hours after online publication and is updated daily on week days.
Initial download of the metrics may take a while.