Fig. 24.
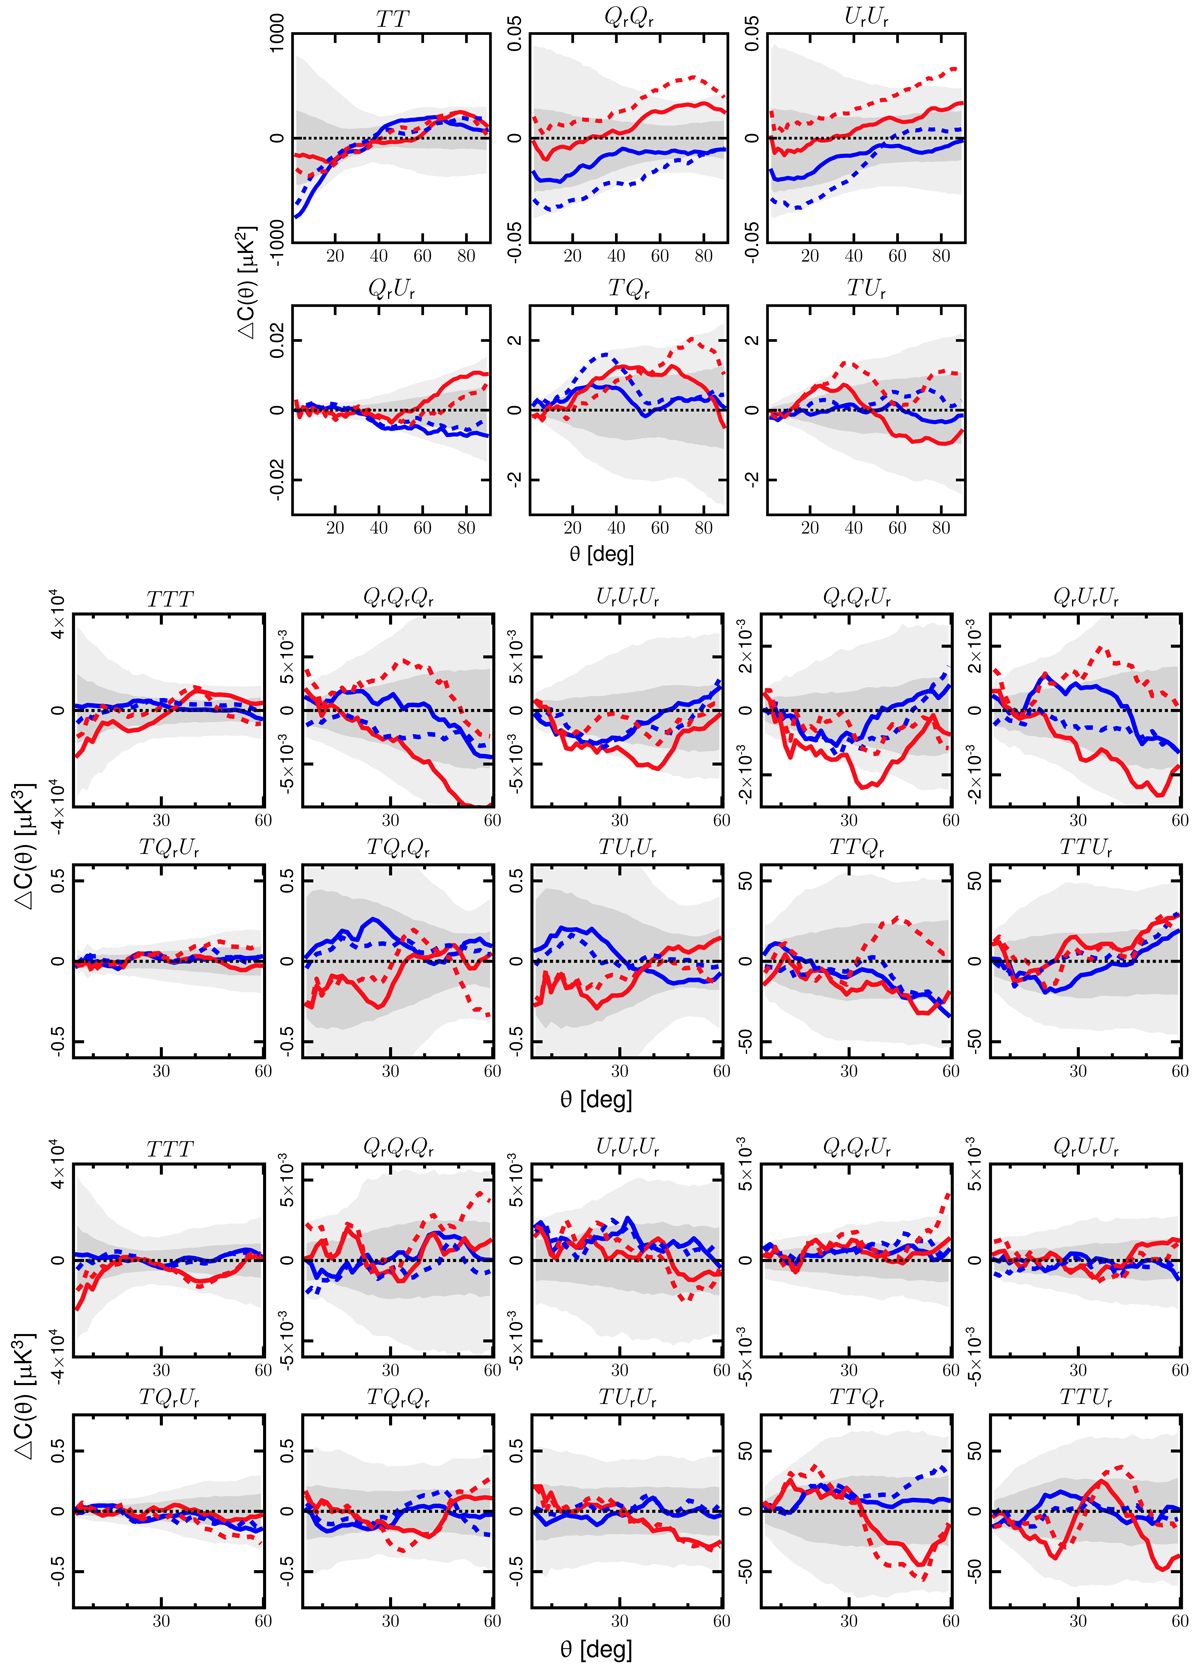
Difference of the N-point correlation functions determined from the Nside = 64 Planck CMB Commander 2018 temperature and polarization maps and the corresponding means estimated from FFP10 MC simulations. Results are shown for the 2-point (upper panels), pseudo-collapsed 3-point (middle panels), and equilateral 3-point (lower panels) functions. The blue and red dashed lines correspond to the functions computed on the negative and positive hemispheres, respectively, determined in the dipole-modulation coordinate frame. The blue and red solid lines correspond to the functions computed on the northern and southern ecliptic hemispheres, respectively. The shaded dark and light grey regions indicate the 68% and 95% confidence regions, respectively, determined for the negative DM hemisphere. See Sect. 5.2 for the definition of the separation angle θ.
Current usage metrics show cumulative count of Article Views (full-text article views including HTML views, PDF and ePub downloads, according to the available data) and Abstracts Views on Vision4Press platform.
Data correspond to usage on the plateform after 2015. The current usage metrics is available 48-96 hours after online publication and is updated daily on week days.
Initial download of the metrics may take a while.