Fig. 22.
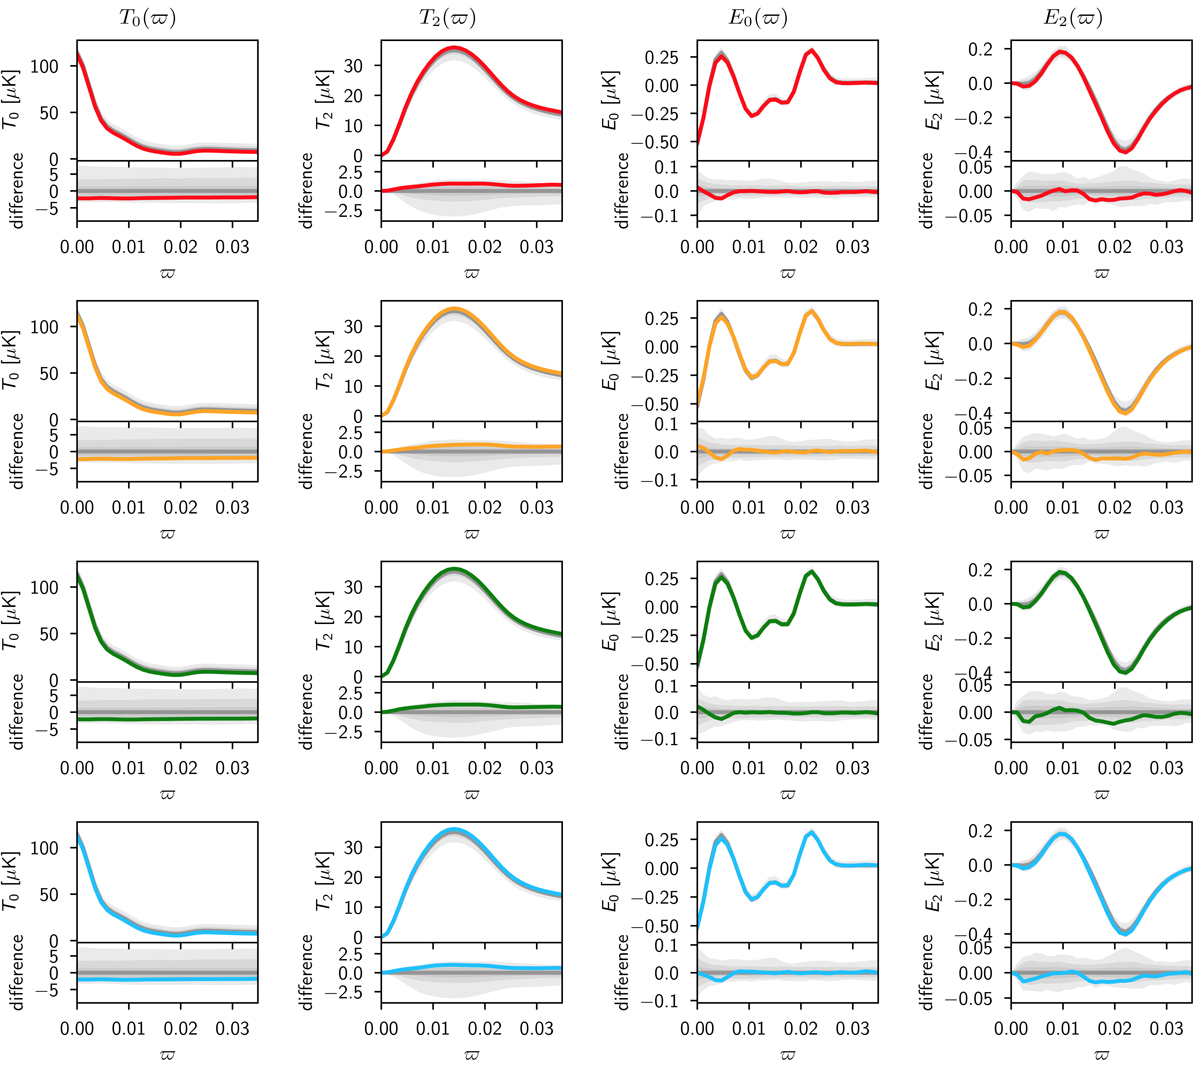
Radial profiles of oriented stacks of intensity T (left two columns) and reconstructed E mode (right two columns) for Commander, NILC, SEVEM, and SMICA pipelines. The top panel in each plot shows the radial profile compared to the simulation average (grey line), while the lower panel shows the difference of the radial profile and simulation average on smaller scales. The shaded grey regions represent 68%, 95%, and minimum-to-maximum bounds for individual realizations.
Current usage metrics show cumulative count of Article Views (full-text article views including HTML views, PDF and ePub downloads, according to the available data) and Abstracts Views on Vision4Press platform.
Data correspond to usage on the plateform after 2015. The current usage metrics is available 48-96 hours after online publication and is updated daily on week days.
Initial download of the metrics may take a while.