Fig. 18.
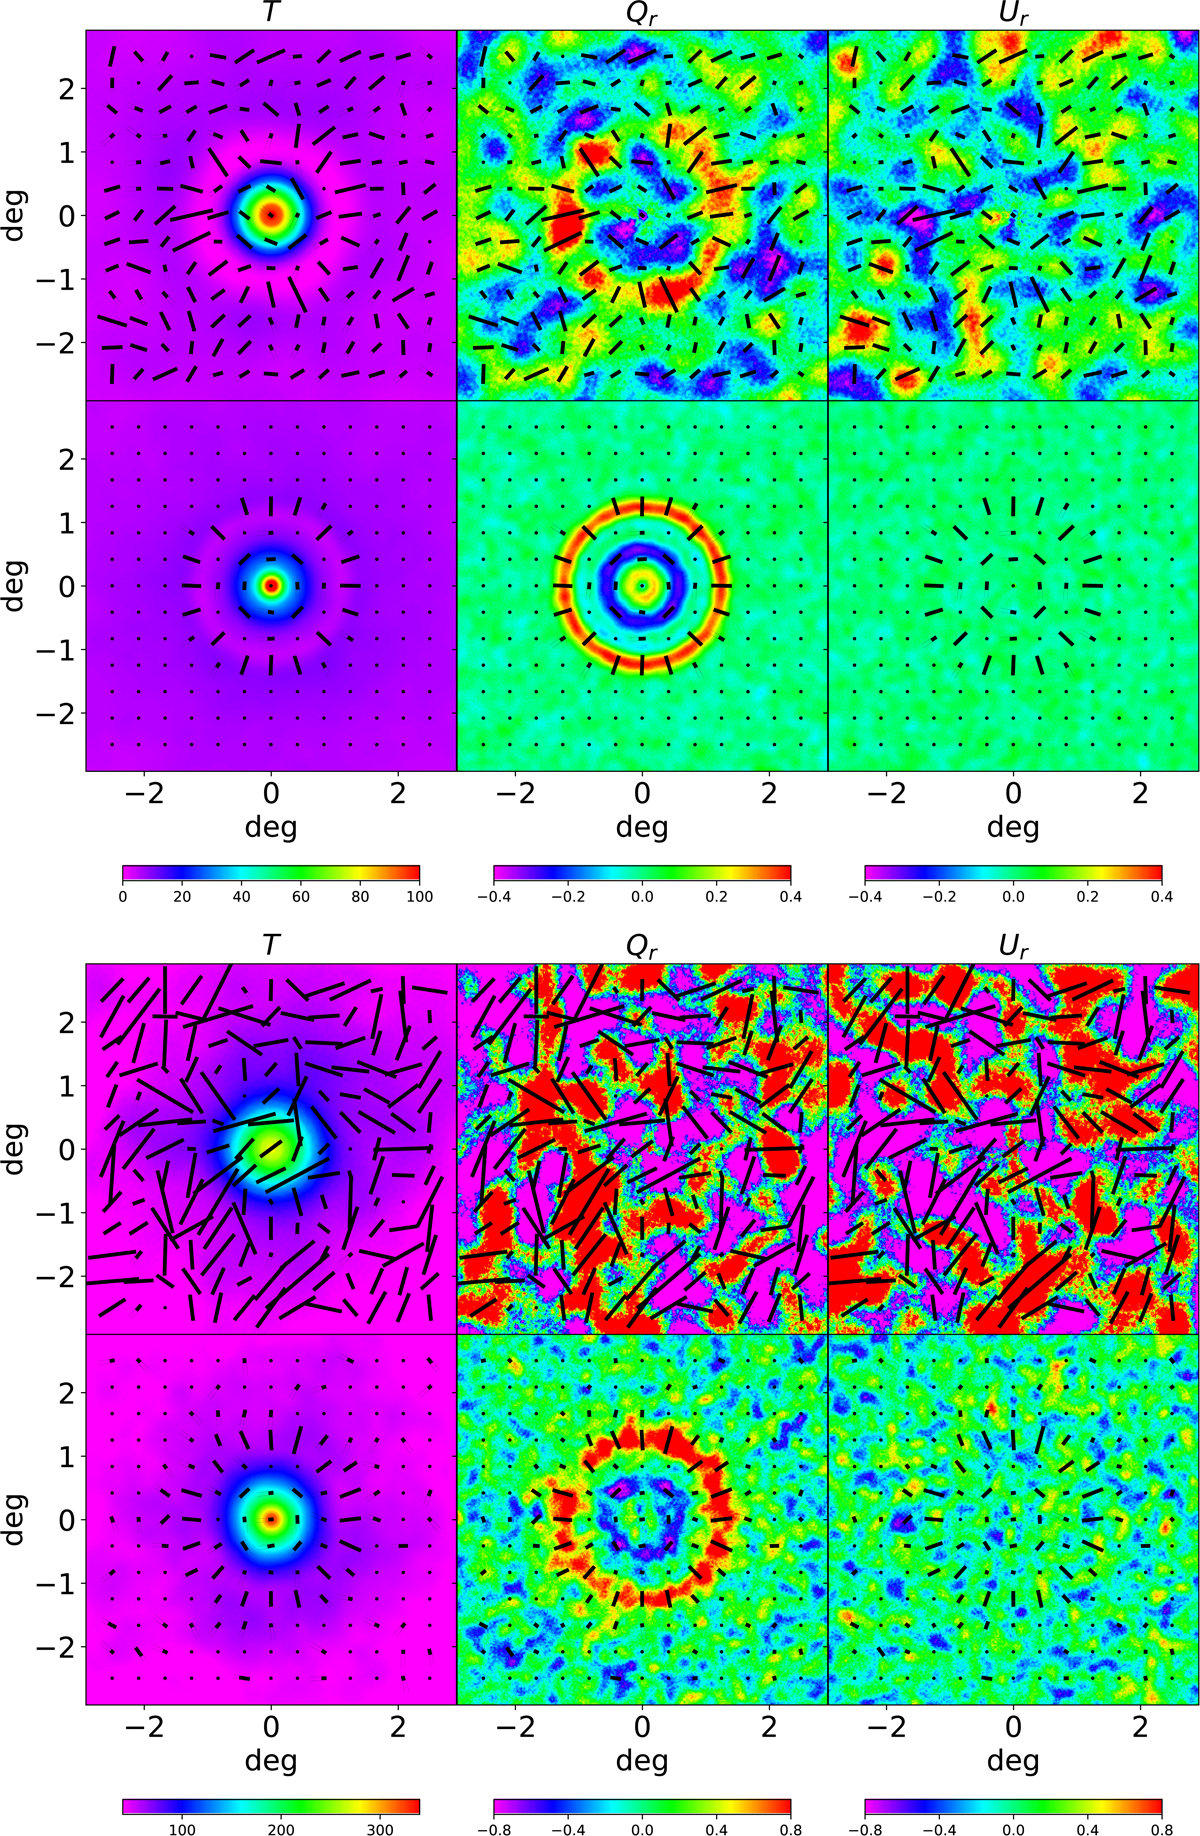
Upper panels: patches of T, Qr, and Ur in micro-Kelvin for maxima above ν = 0 from the WMAP V+W data at a HEALPix resolution of Nside = 512 convolved with a Gaussian beam of 30′ (first row), and from the SEVEM data at a HEALPix resolution of Nside = 1024 convolved with a Gaussian beam of 10′ (second row). Lower panels: the same thing, but only for maxima above ν = 3. The polarization direction is represented as a headless vector. Note that, in the bottom panel, the length of the headless vectors is divided by 3 with respect to the scale used in the upper panel.
Current usage metrics show cumulative count of Article Views (full-text article views including HTML views, PDF and ePub downloads, according to the available data) and Abstracts Views on Vision4Press platform.
Data correspond to usage on the plateform after 2015. The current usage metrics is available 48-96 hours after online publication and is updated daily on week days.
Initial download of the metrics may take a while.