Fig. 17.
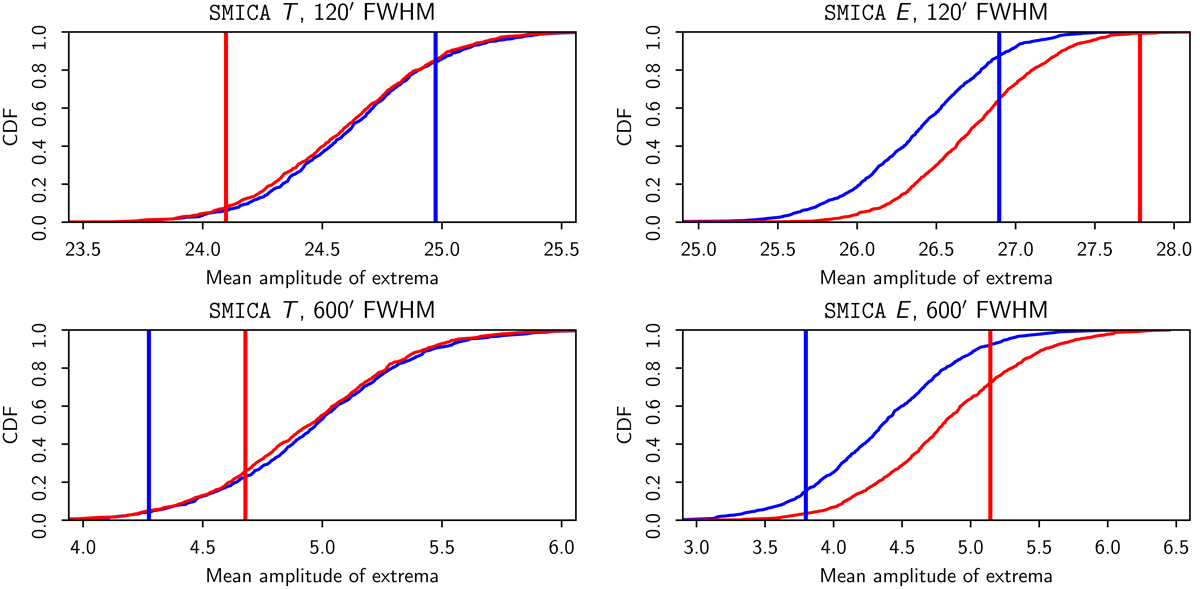
Cumulative density-function of the mean amplitude of all extrema, maxima (red) and minima (blue), derived from simulations, compared to the equivalent values observed for the SMICA temperature T (left) and the reconstructed E-mode polarization (right). Upper panel: peak mean amplitudes for maps filtered with a GAUSS kernel of 120′ FWHM. Lower panel: corresponding peak CDF for the same kernel of 600′ FWHM. Similar results are obtained for the other component separation methods. The amplitude values are shown in arbitrary (dimensionless) units determined by map pre-whitening.
Current usage metrics show cumulative count of Article Views (full-text article views including HTML views, PDF and ePub downloads, according to the available data) and Abstracts Views on Vision4Press platform.
Data correspond to usage on the plateform after 2015. The current usage metrics is available 48-96 hours after online publication and is updated daily on week days.
Initial download of the metrics may take a while.