Fig. 10.
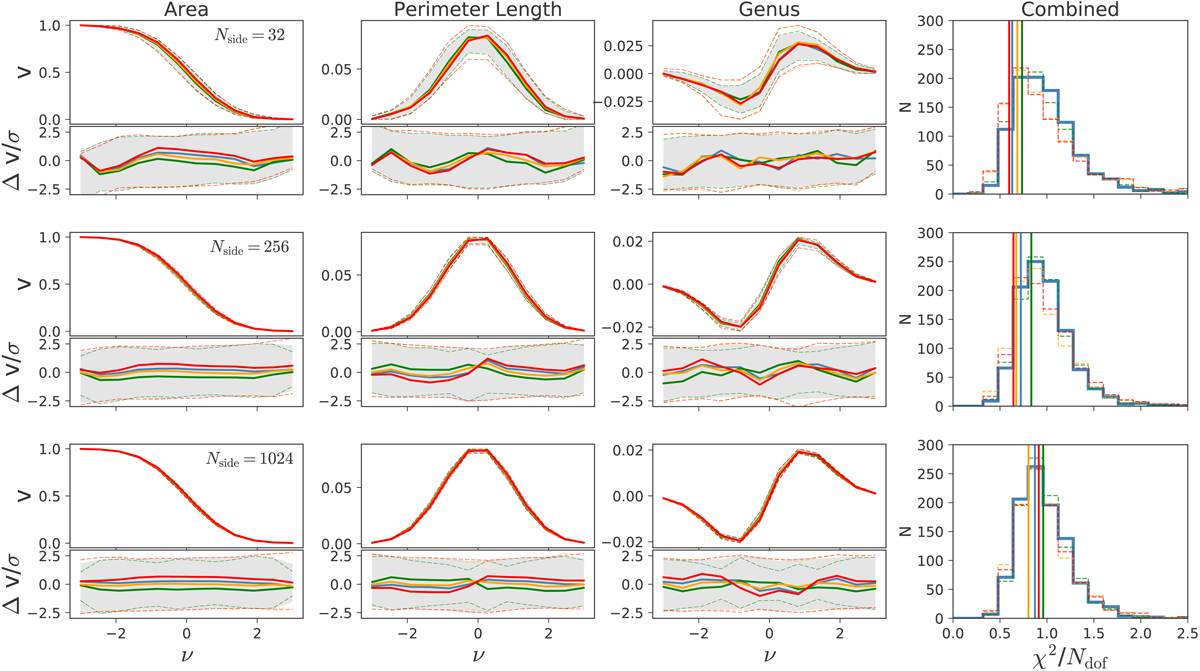
Real-space normalized MFs determined from the Planck 2018 temperature data using the four component-separated maps, Commander (red), NILC (orange), SEVEM (green), and SMICA (blue). The grey region corresponds to the 99th percentile area, estimated from the FFP10 simulations processed by the SMICA method, while the dashed curves with matching colours outline the same interval for the other component-separation methods. Results are shown for analyses at Nside = 32, 256, and 1024. The right-most column shows the χ2 obtained by combining the three MFs in real space with an appropriate covariance matrix derived from FFP10 simulations. The vertical lines correspond to values from the Planck data.
Current usage metrics show cumulative count of Article Views (full-text article views including HTML views, PDF and ePub downloads, according to the available data) and Abstracts Views on Vision4Press platform.
Data correspond to usage on the plateform after 2015. The current usage metrics is available 48-96 hours after online publication and is updated daily on week days.
Initial download of the metrics may take a while.