Fig. 8.
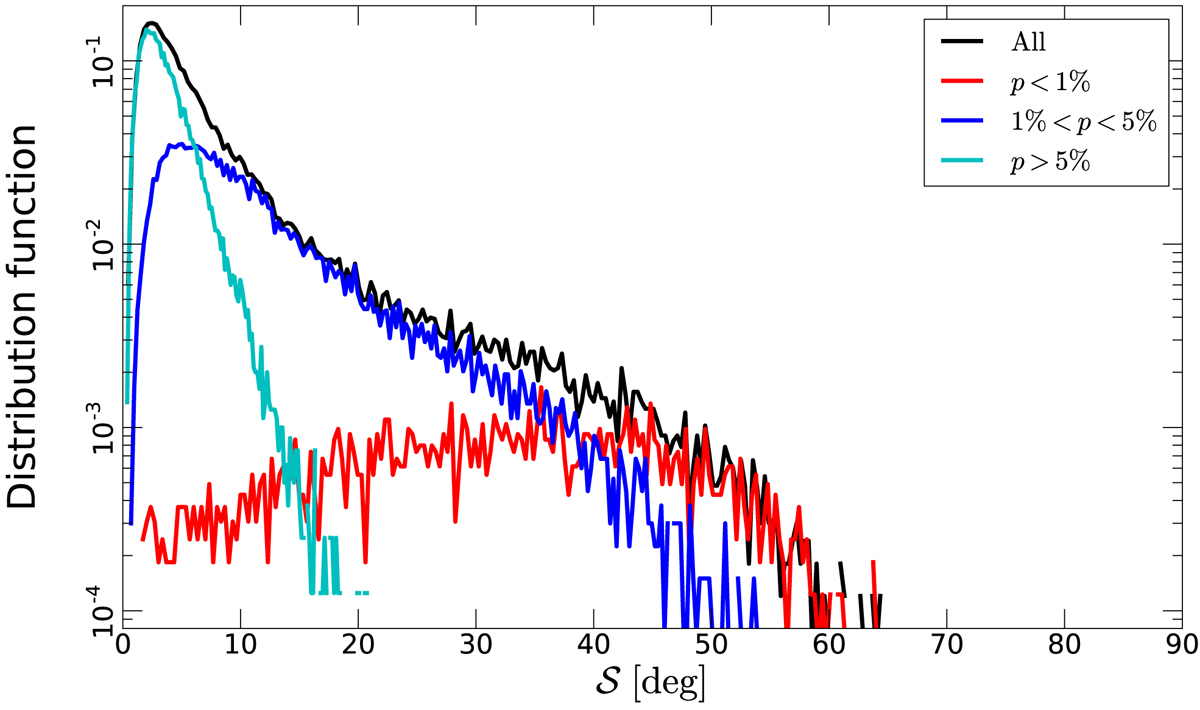
Distribution functions of 𝒮 at 160′ resolution and using a lag of δ = 80′, for different ranges of p, using the fiducial total intensity offset. The distribution function for all points is shown in black and for different ranges of p in separate colours. The distribution functions for the different subsets are scaled to the fractional number of points contained in each range.
Current usage metrics show cumulative count of Article Views (full-text article views including HTML views, PDF and ePub downloads, according to the available data) and Abstracts Views on Vision4Press platform.
Data correspond to usage on the plateform after 2015. The current usage metrics is available 48-96 hours after online publication and is updated daily on week days.
Initial download of the metrics may take a while.