Fig. 7.
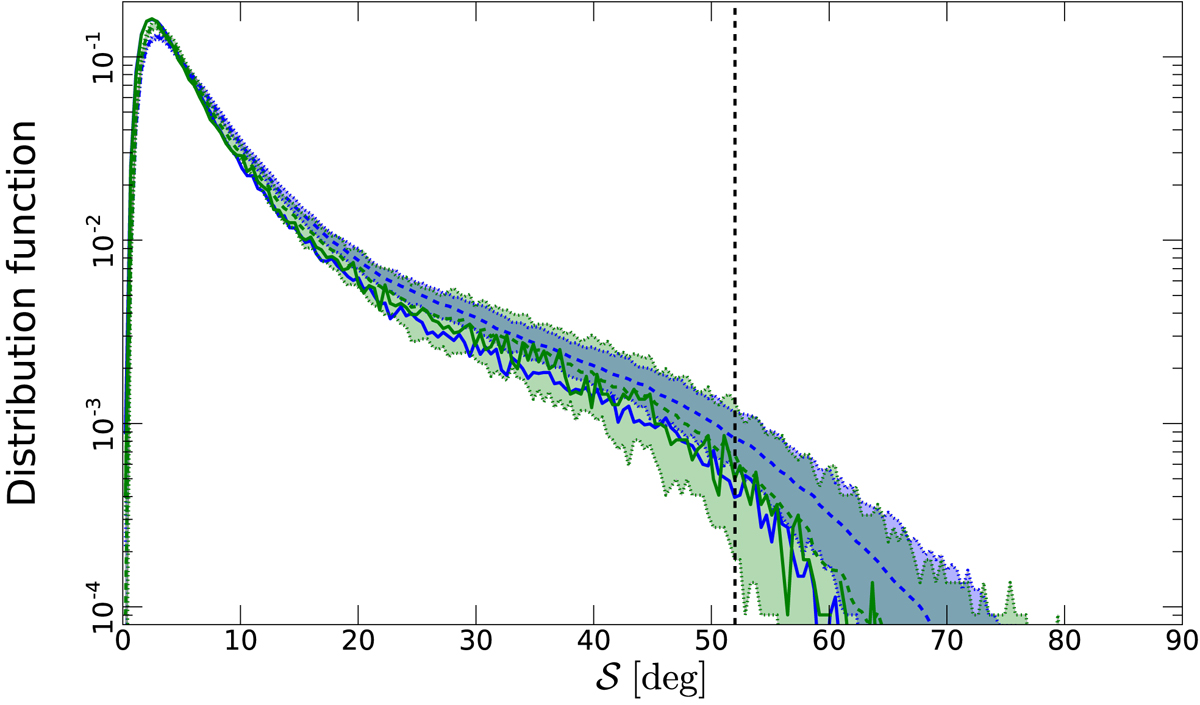
Distribution functions of the polarization angle dispersion function 𝒮 in the GNILC data at 353 GHz. The cases shown are for the 160′ resolution using a lag δ = 80′ (in green), and for the 80′ resolution using a lag δ = 40′ (in blue). The solid curves show the histograms computed directly from the GNILC maps, the dashed curves give the mean histogram from the 1000 Monte Carlo realizations for each case, and the coloured regions show the envelope. The dashed vertical line indicates the value ![]() corresponding to a completely random polarization pattern.
corresponding to a completely random polarization pattern.
Current usage metrics show cumulative count of Article Views (full-text article views including HTML views, PDF and ePub downloads, according to the available data) and Abstracts Views on Vision4Press platform.
Data correspond to usage on the plateform after 2015. The current usage metrics is available 48-96 hours after online publication and is updated daily on week days.
Initial download of the metrics may take a while.