Fig. 6.
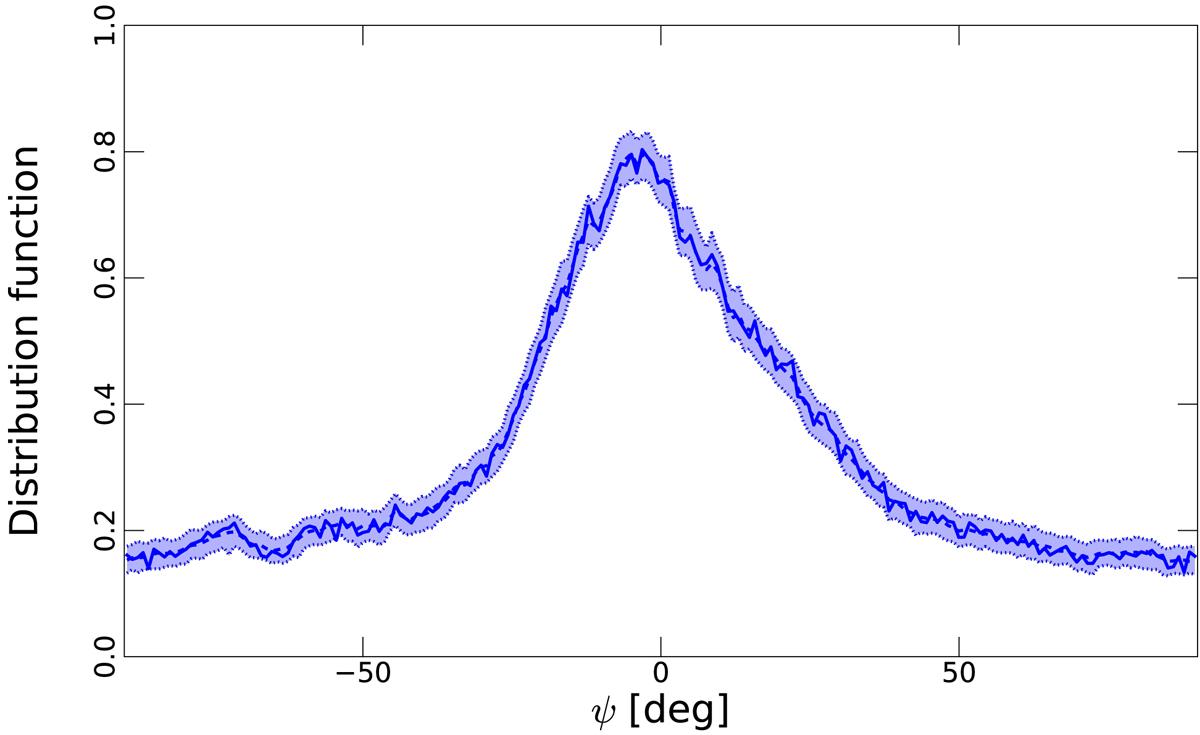
Distribution function for the polarization angle ψ in Galactic coordinates for the GNILC data at 353 GHz and uniform 80′ resolution. The solid curve shows the histogram of the polarization angles computed directly from the GNILC data, the dashed curve gives the mean of the 1000 Monte Carlo histograms, and the blue region shows the envelope spanned by the 1000 histograms.
Current usage metrics show cumulative count of Article Views (full-text article views including HTML views, PDF and ePub downloads, according to the available data) and Abstracts Views on Vision4Press platform.
Data correspond to usage on the plateform after 2015. The current usage metrics is available 48-96 hours after online publication and is updated daily on week days.
Initial download of the metrics may take a while.