Fig. 5.
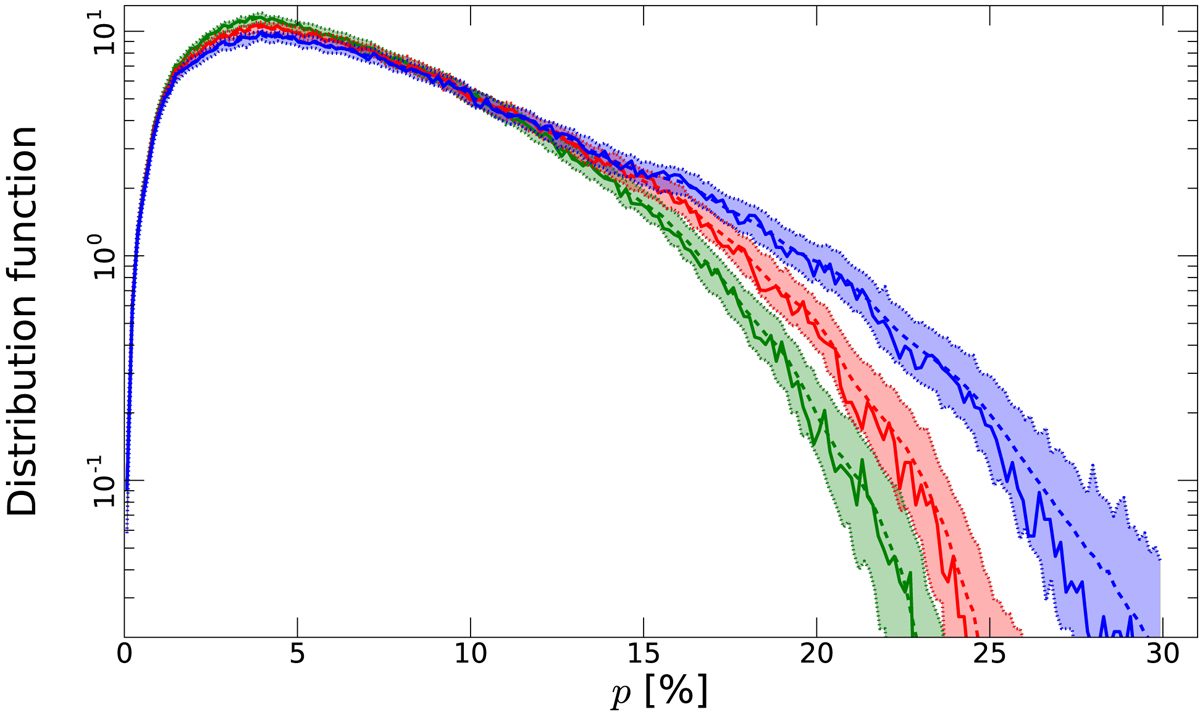
Distribution functions of the polarization fraction p in the GNILC data at 353 GHz and uniform 80′ resolution. The solid red curve corresponds to the fiducial Galactic offset for the total intensity, whereas blue and green correspond to the cases of low and high offset, respectively. The dashed curves show the mean over the 1000 Monte Carlo histograms, and the envelopes shown as coloured regions span the range of the 1000 histograms.
Current usage metrics show cumulative count of Article Views (full-text article views including HTML views, PDF and ePub downloads, according to the available data) and Abstracts Views on Vision4Press platform.
Data correspond to usage on the plateform after 2015. The current usage metrics is available 48-96 hours after online publication and is updated daily on week days.
Initial download of the metrics may take a while.