Fig. G.2.
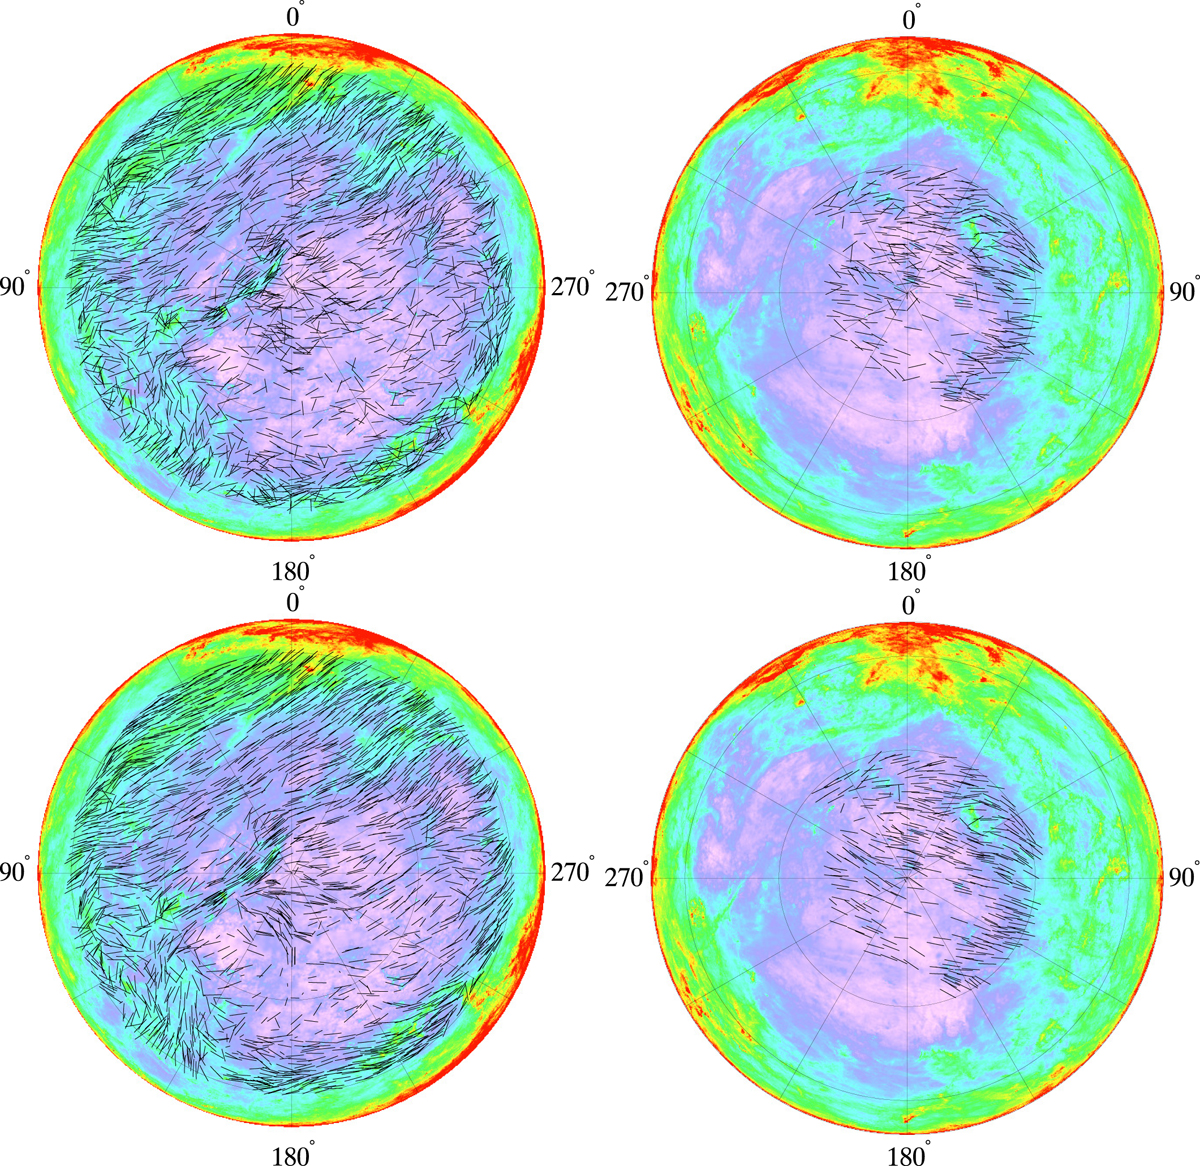
Comparison of the orientation of the projection of the magnetic field on the plane of the sky, in orthographic projection with the dust optical depth at 353 GHz as the coloured background, from optical data (top panels) and from Planck data at 353 GHz (bottom panels). The line length is proportional to the S/N on the polarization angle. Northern (left panels) and southern (right panels) Galactic hemispheres are shown, with the Galactic centre situated at the top of each map.
Current usage metrics show cumulative count of Article Views (full-text article views including HTML views, PDF and ePub downloads, according to the available data) and Abstracts Views on Vision4Press platform.
Data correspond to usage on the plateform after 2015. The current usage metrics is available 48-96 hours after online publication and is updated daily on week days.
Initial download of the metrics may take a while.