Fig. G.1.
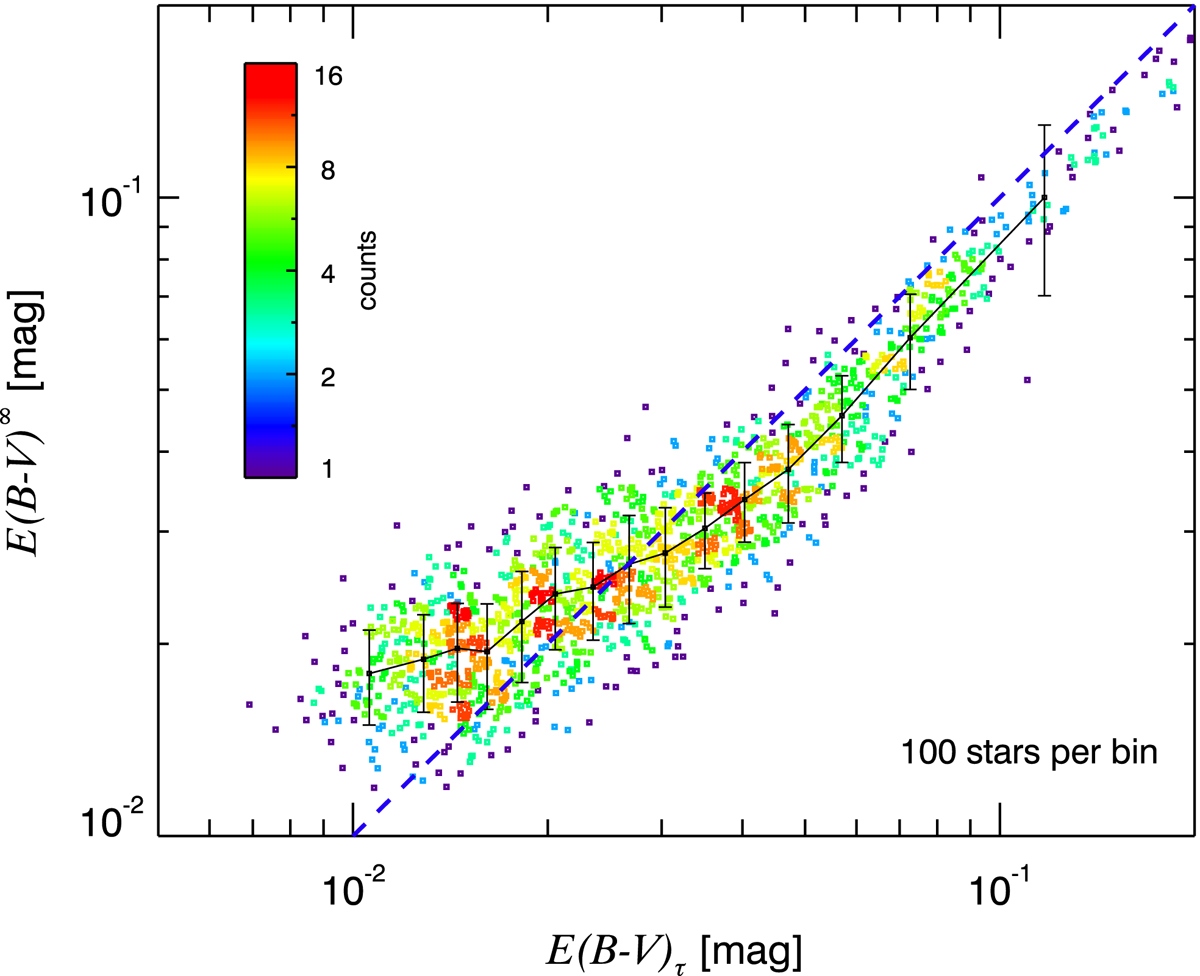
Total reddening observed in the optical, E(B − V)∞, as a function of E(B − V)τ, the dust optical depth at 353 GHz converted to a reddening, for the 1505 selected stars (Sect. 6.3). Each bin of the running mean contains the same number of lines of sight. Error bars represent the standard deviation in each bin. The dashed line corresponds to a one-to-one correlation.
Current usage metrics show cumulative count of Article Views (full-text article views including HTML views, PDF and ePub downloads, according to the available data) and Abstracts Views on Vision4Press platform.
Data correspond to usage on the plateform after 2015. The current usage metrics is available 48-96 hours after online publication and is updated daily on week days.
Initial download of the metrics may take a while.