Fig. F.5.
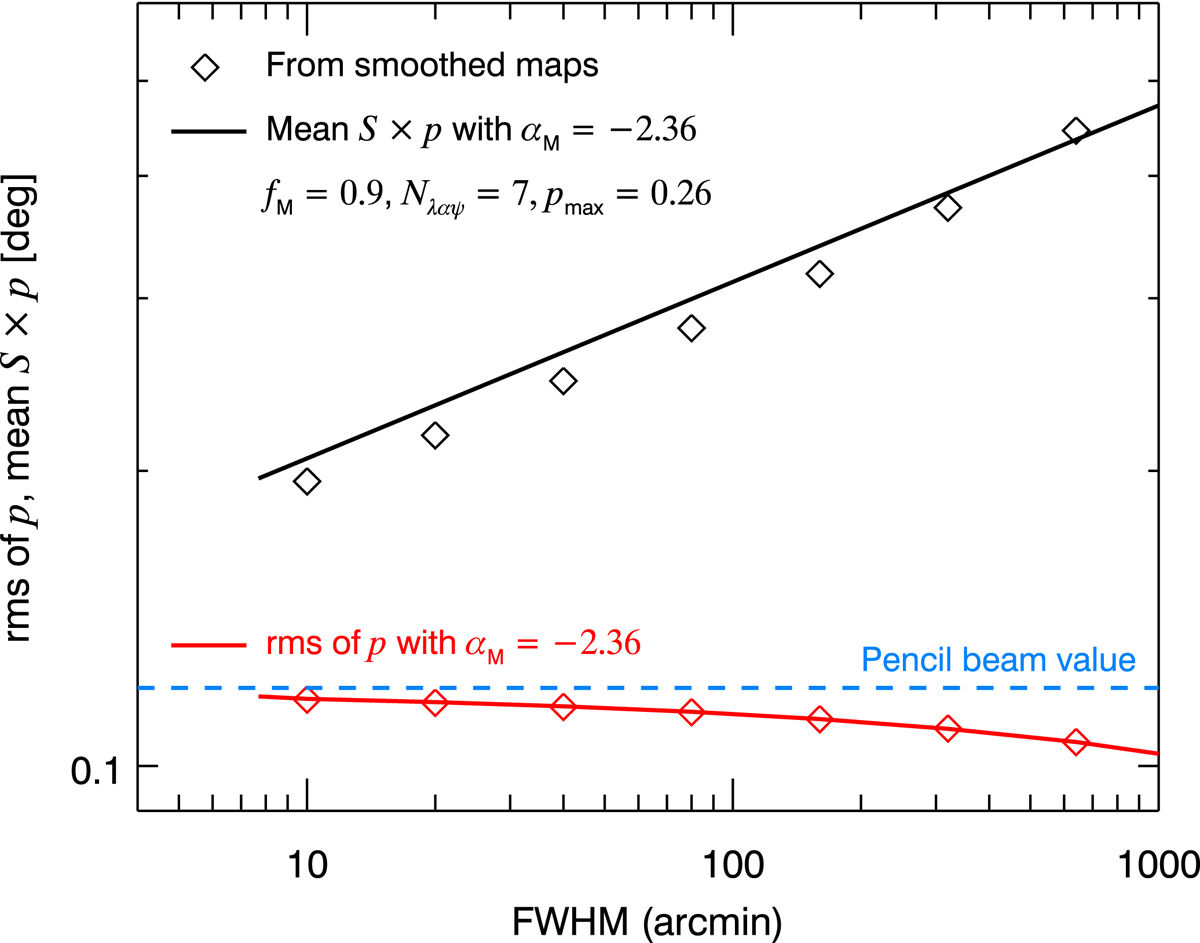
Comparison between numerical results based on smoothed maps of our model of the turbulent magnetic field (diamonds) and the application of our analytical expressions for the decrease in the rms of p (red) by depolarization (Eq. (F.62) with ω = 160′) and the increase in 𝒮 × p (black) with the resolution (Eqs. (F.53) and (F.45)). The fractional difference is less than 10% for 𝒮 × p. The dashed blue line represents the pencil beam value for the rms of p, as calculated from Eq. (F.63) based on the model taken at ω = 160′.
Current usage metrics show cumulative count of Article Views (full-text article views including HTML views, PDF and ePub downloads, according to the available data) and Abstracts Views on Vision4Press platform.
Data correspond to usage on the plateform after 2015. The current usage metrics is available 48-96 hours after online publication and is updated daily on week days.
Initial download of the metrics may take a while.