Fig. F.4.
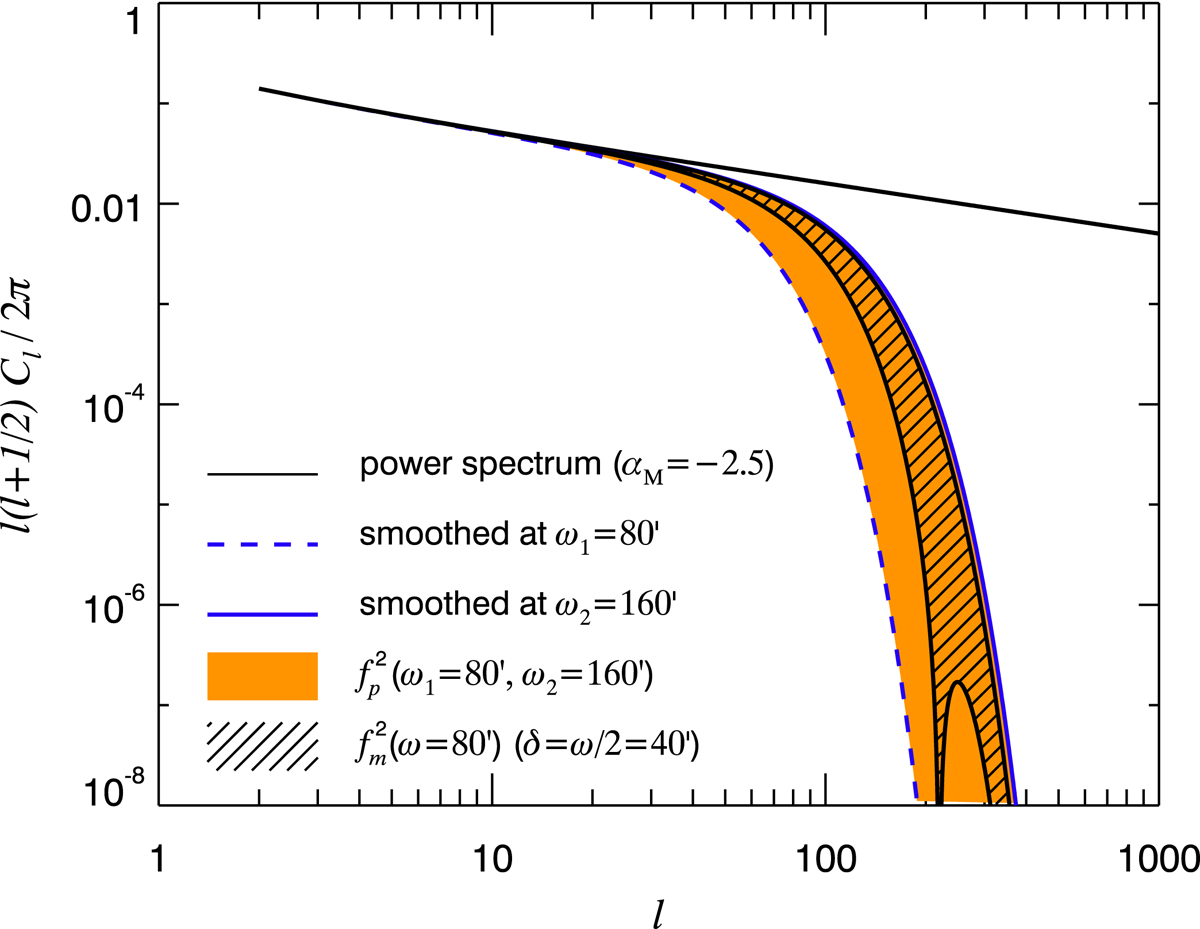
Power spectrum ℓ(ℓ + 1/2) Cℓ/(2π) of a turbulent component of index αM = −2.5, as a function of the multipole ℓ. The differential energy lost by smoothing the maps from an initial resolution ω1 = 80′ to ω2 = 160′ is filled in orange, representing a fraction ![]() of the original power in the turbulent component (see text in Appendix F.8 and Eq. (F.54)). Shown as hatched is the turbulent energy implied in the calculation of 𝒮 at a resolution of ω = 80′ (with δ = ω/2 = 40′), which is a fraction
of the original power in the turbulent component (see text in Appendix F.8 and Eq. (F.54)). Shown as hatched is the turbulent energy implied in the calculation of 𝒮 at a resolution of ω = 80′ (with δ = ω/2 = 40′), which is a fraction ![]() of the original power in the turbulent component (see text in Appendix F.7 and Eq. (F.51)). Both coloured and hatched regions scale with the resolution ω as ω−2 − αM.
of the original power in the turbulent component (see text in Appendix F.7 and Eq. (F.51)). Both coloured and hatched regions scale with the resolution ω as ω−2 − αM.
Current usage metrics show cumulative count of Article Views (full-text article views including HTML views, PDF and ePub downloads, according to the available data) and Abstracts Views on Vision4Press platform.
Data correspond to usage on the plateform after 2015. The current usage metrics is available 48-96 hours after online publication and is updated daily on week days.
Initial download of the metrics may take a while.