Fig. E.1.
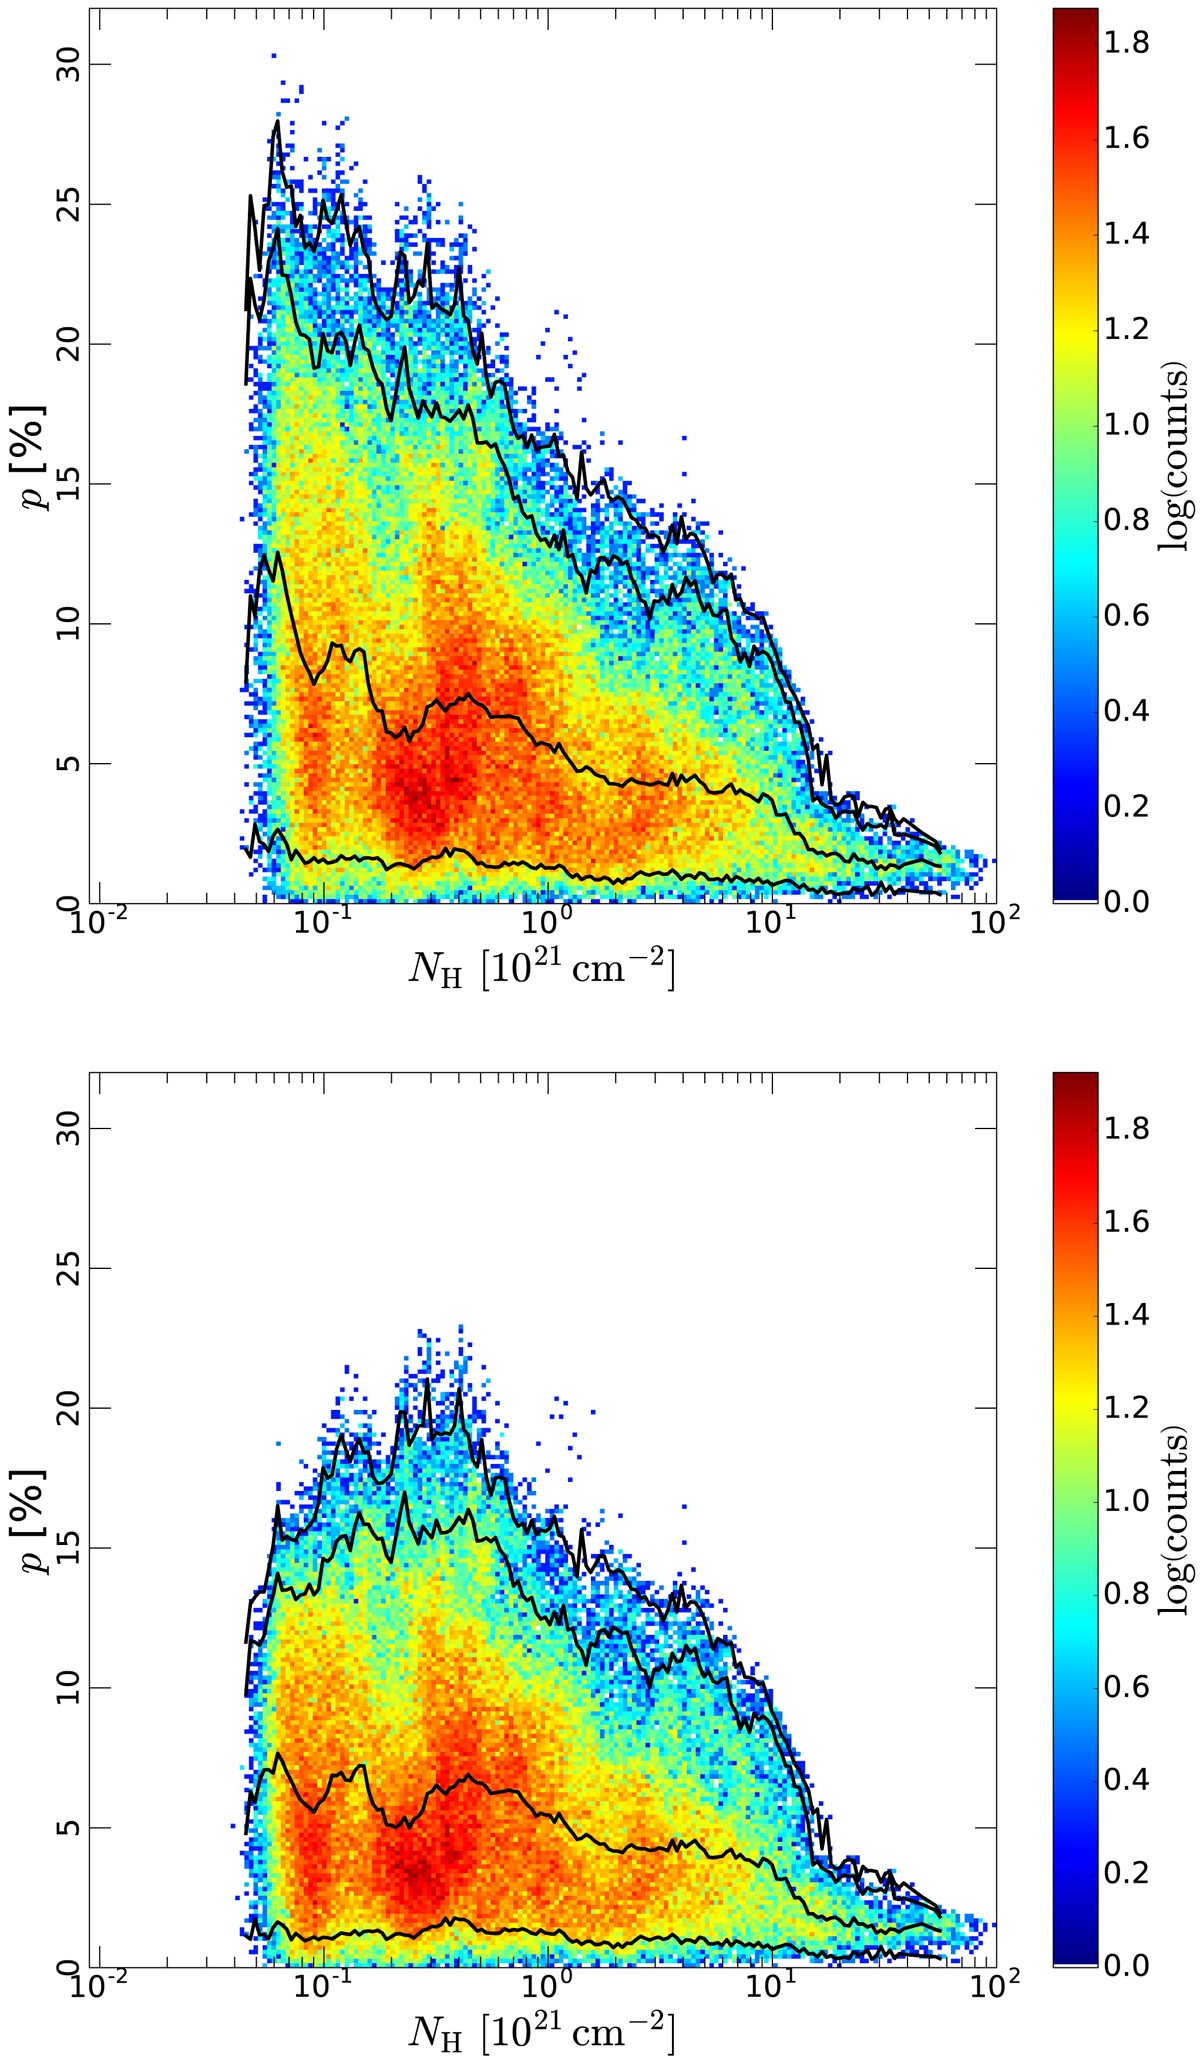
Two-dimensional histograms showing the joint distribution function of the polarization fraction p from the GNILC data (at 353 GHz and uniform 80′ resolution) and the total gas column density NH. The top plot corresponds to the low total intensity offset, while the bottom plot corresponds to the high total intensity offset. The black lines show the 5th, 95th, and 99th percentiles of the p distribution in each NH bin, as well as the median p in each NH bin.
Current usage metrics show cumulative count of Article Views (full-text article views including HTML views, PDF and ePub downloads, according to the available data) and Abstracts Views on Vision4Press platform.
Data correspond to usage on the plateform after 2015. The current usage metrics is available 48-96 hours after online publication and is updated daily on week days.
Initial download of the metrics may take a while.