Fig. D.2.
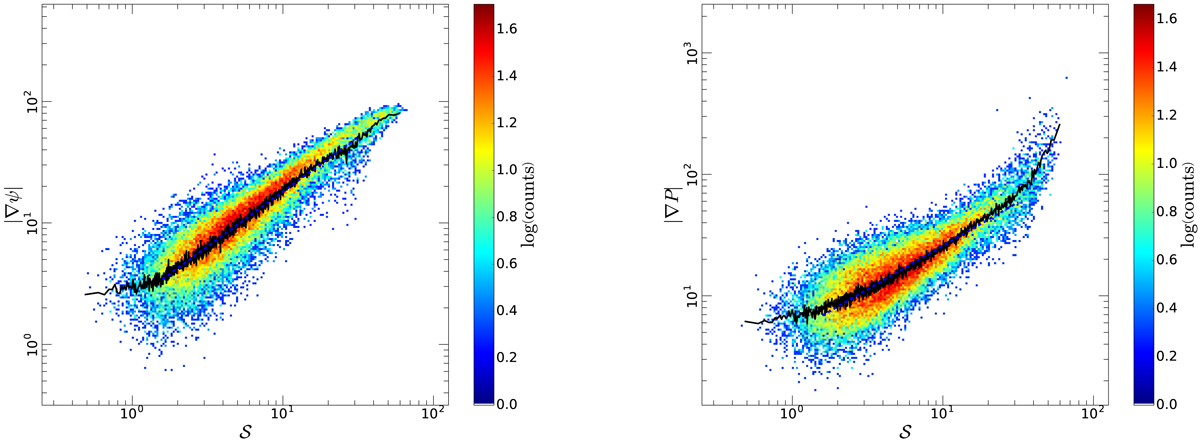
Left: two-dimensional histogram representation of the correlation plot between the angular polarization gradient |∇ψ| and the angular dispersion function 𝒮 from the GNILC-processed Planck data at 353 GHz and 160′ resolution, with a lag of 80′ for 𝒮. Right: correlation plot between the polarization gradient |∇P| and the angular dispersion function 𝒮. In both plots, the solid black curve shows the mean |∇ψ| or |∇P| in a given bin of 𝒮.
Current usage metrics show cumulative count of Article Views (full-text article views including HTML views, PDF and ePub downloads, according to the available data) and Abstracts Views on Vision4Press platform.
Data correspond to usage on the plateform after 2015. The current usage metrics is available 48-96 hours after online publication and is updated daily on week days.
Initial download of the metrics may take a while.