Fig. C.4.
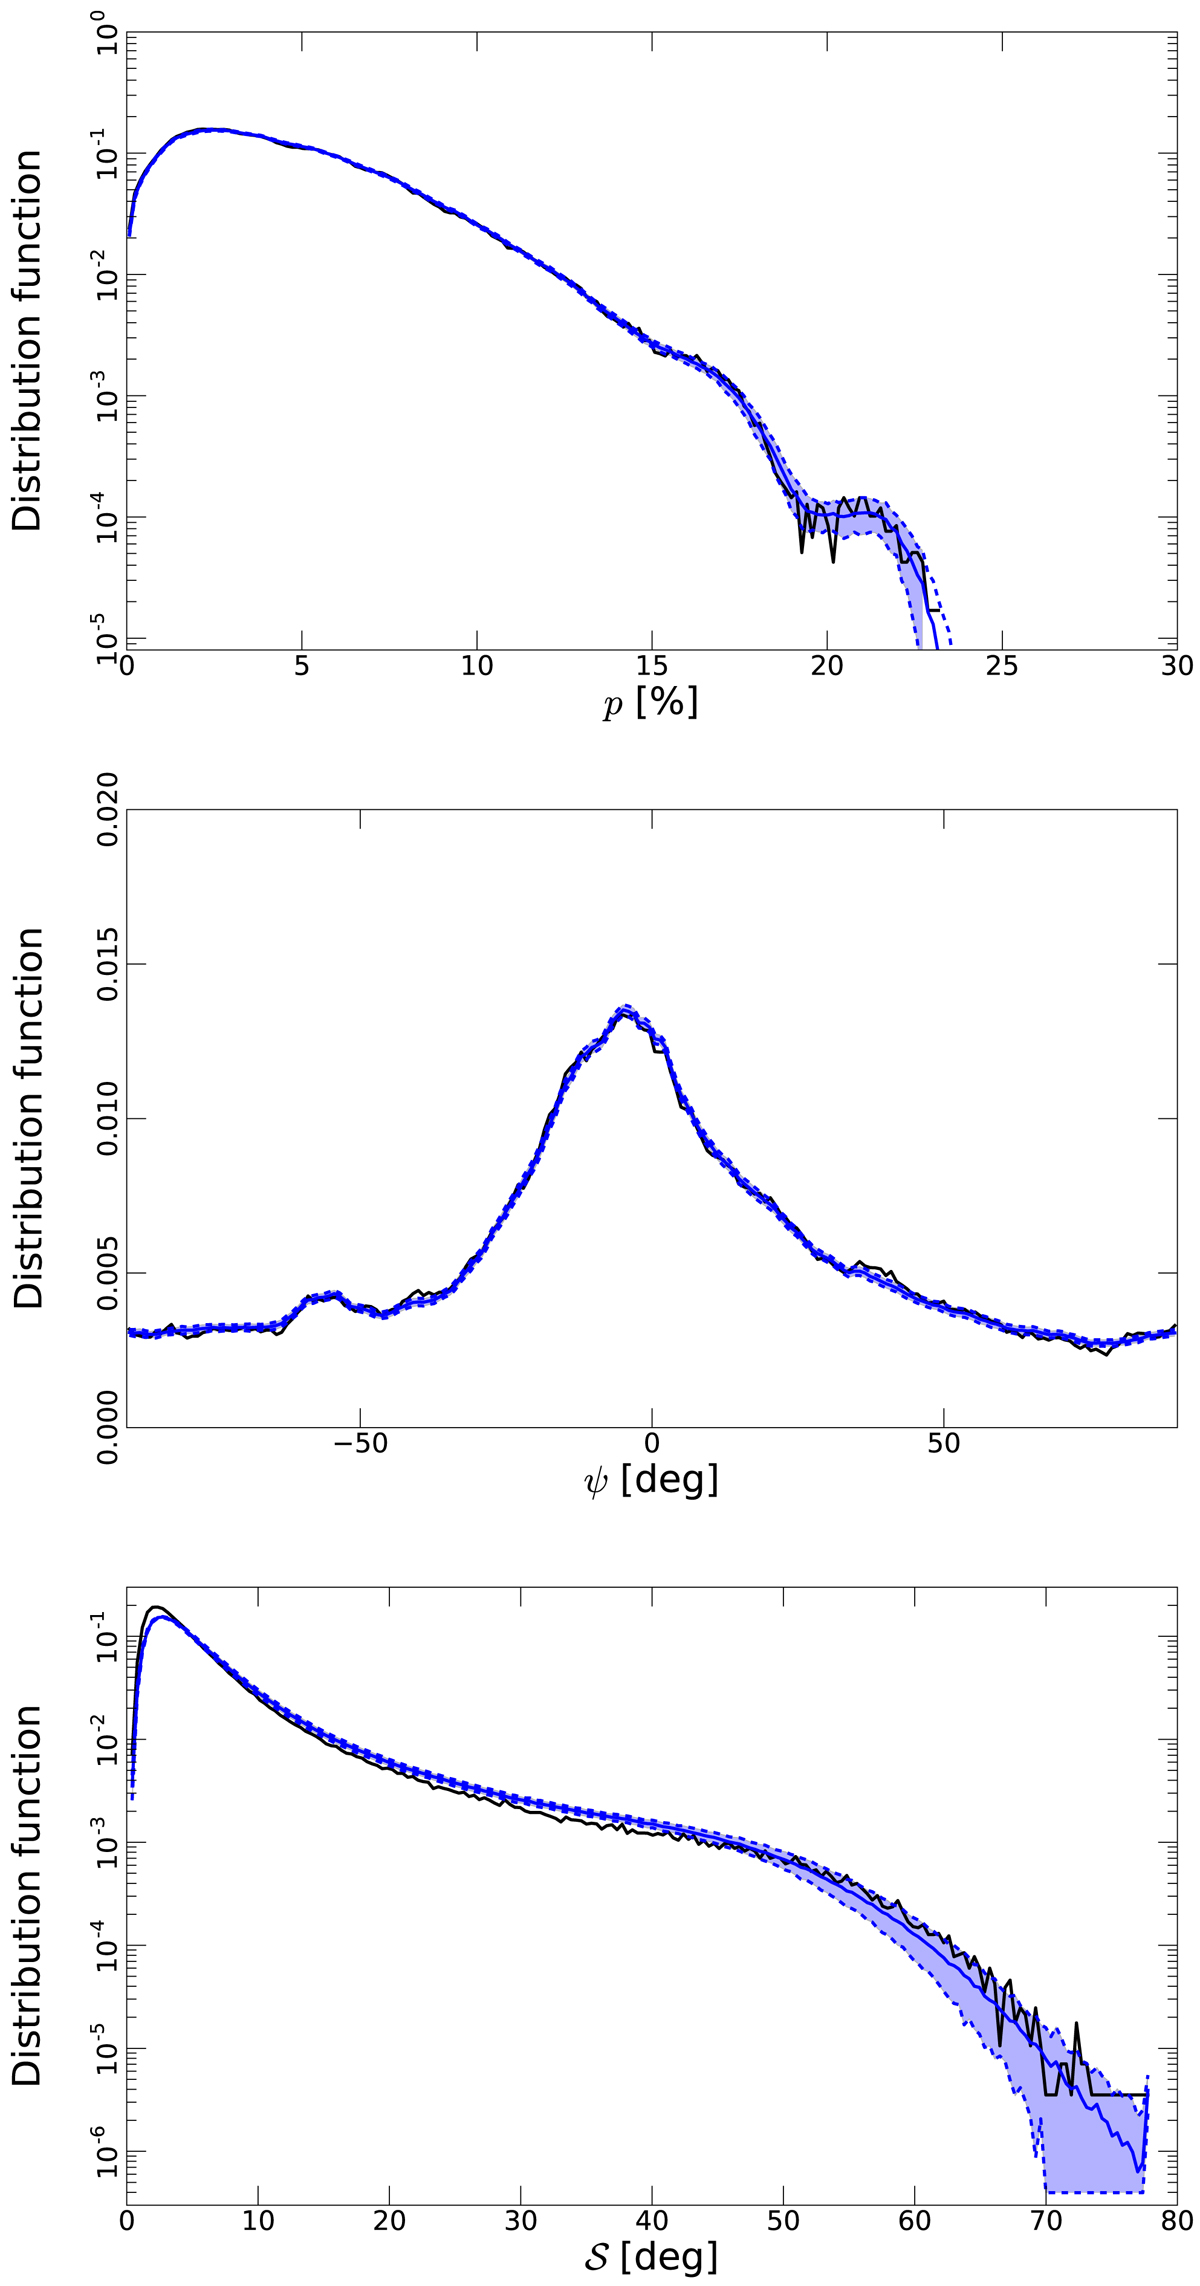
Histogram of the polarization fractions (top), polarization angles (middle), and polarization angle dispersion functions (bottom). The input data are shown by the black curves and the output of the E2E simulations by the solid blue curves (which are the average of 100 histograms from the 100 simulations), while the dashed lines with blue shading between show the ±1σ dispersion.
Current usage metrics show cumulative count of Article Views (full-text article views including HTML views, PDF and ePub downloads, according to the available data) and Abstracts Views on Vision4Press platform.
Data correspond to usage on the plateform after 2015. The current usage metrics is available 48-96 hours after online publication and is updated daily on week days.
Initial download of the metrics may take a while.