Fig. C.2.
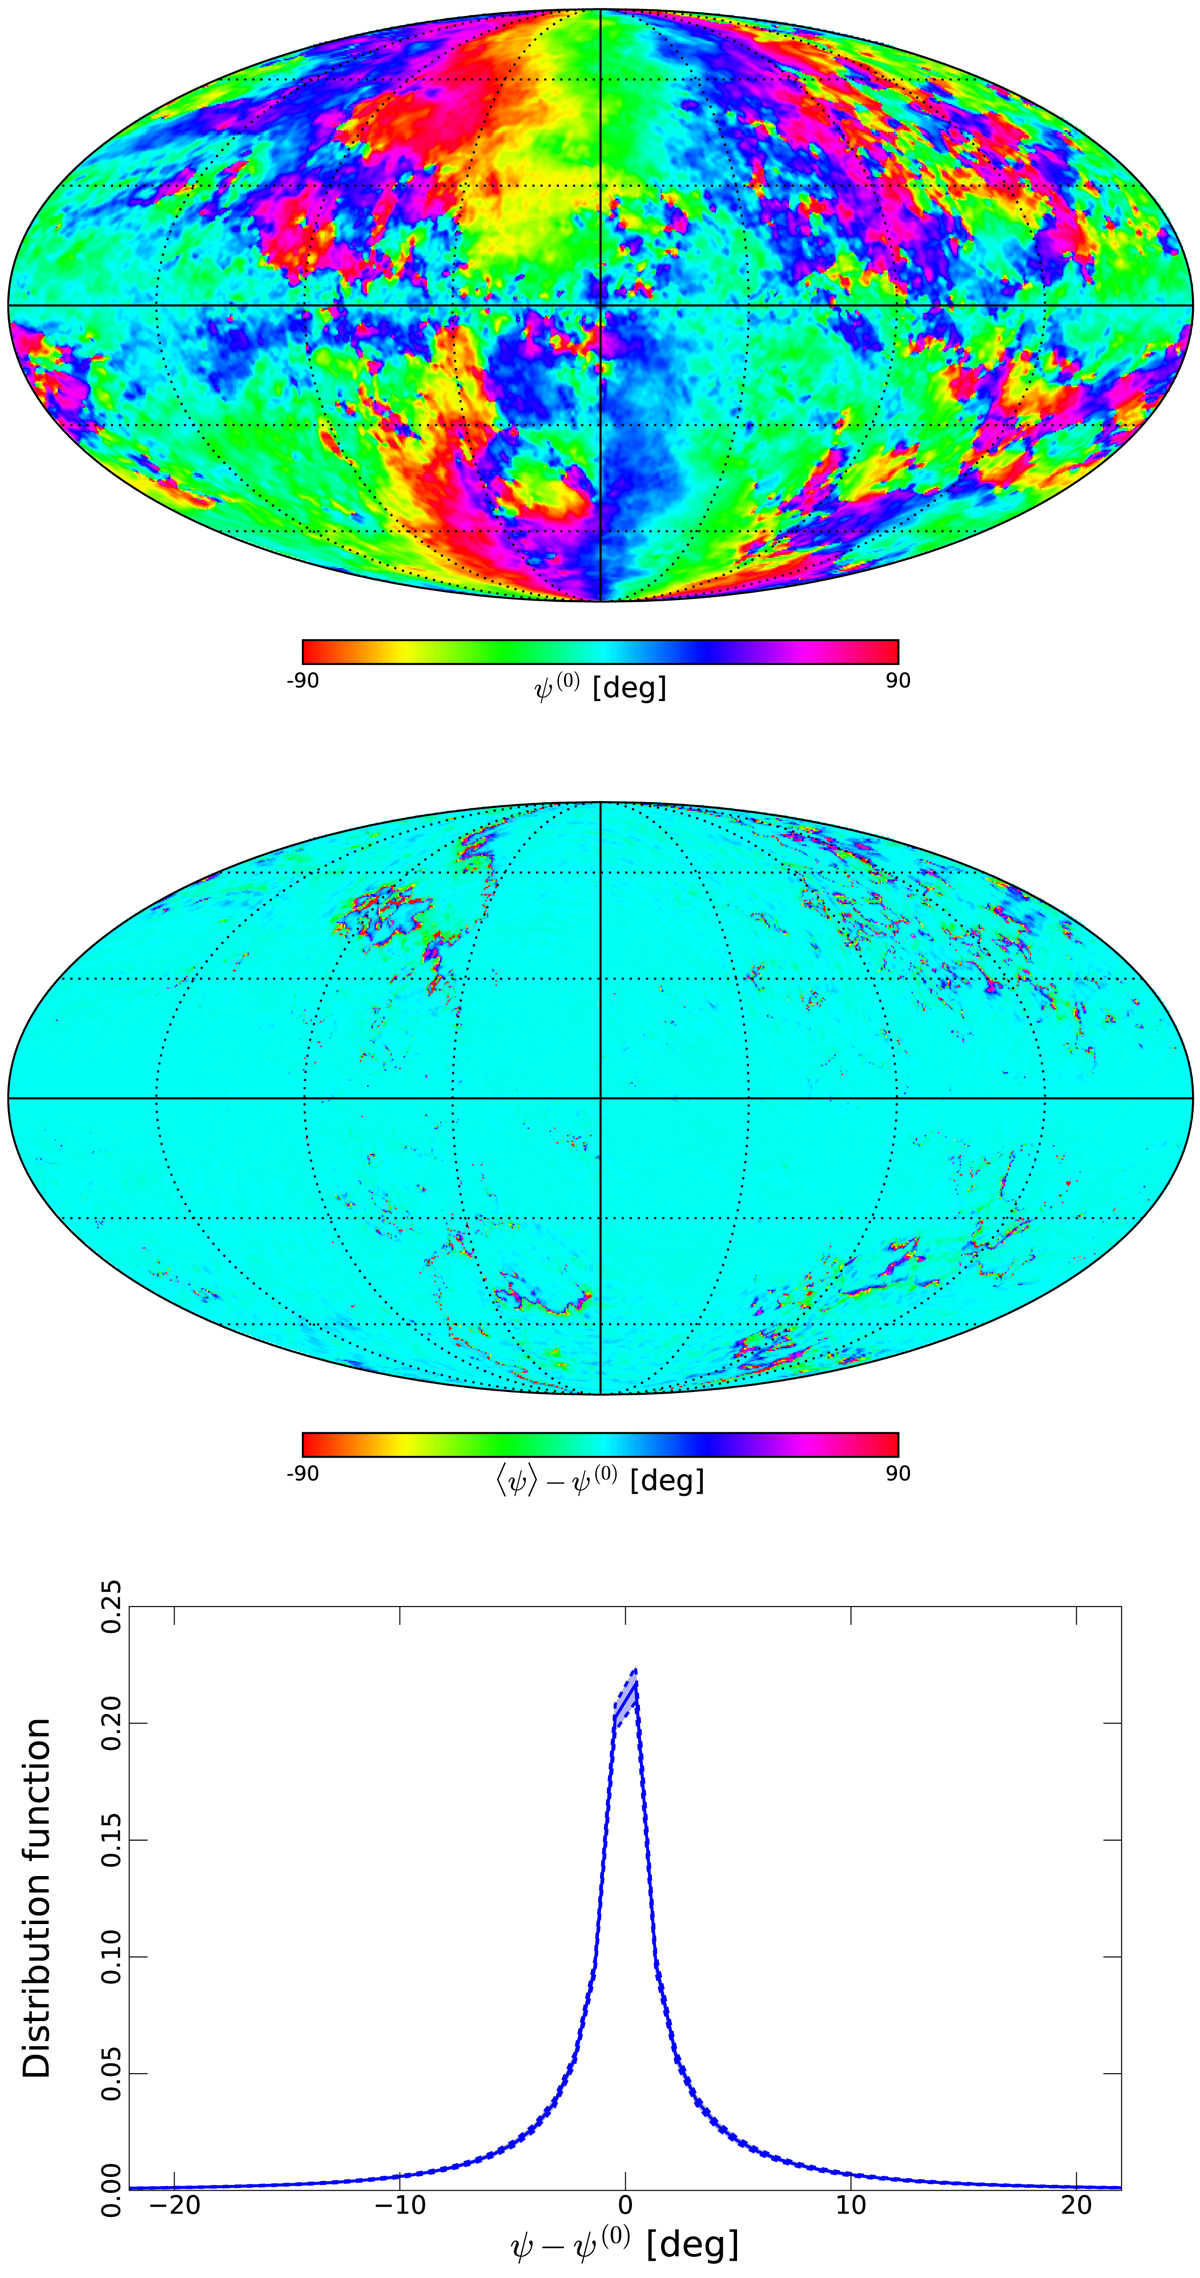
Top: map of the polarization angle ψ(0) for the input sky of the E2E simulations, at 60′ resolution. Middle: map of the difference between the polarization angle averaged over the 100 realizations of the E2E simulations, ⟨ψ⟩, and the input polarization angle ψ(0), at 60′ resolution. Bottom: distribution function over the sky of the difference between the output and input polarization angle. The solid blue curve is the average of 100 histograms of ψ − ψ(0) from the 100 realizations, while the dashed lines with blue shading between show the ±1 σ dispersion.
Current usage metrics show cumulative count of Article Views (full-text article views including HTML views, PDF and ePub downloads, according to the available data) and Abstracts Views on Vision4Press platform.
Data correspond to usage on the plateform after 2015. The current usage metrics is available 48-96 hours after online publication and is updated daily on week days.
Initial download of the metrics may take a while.