Open Access
Fig. B.3.
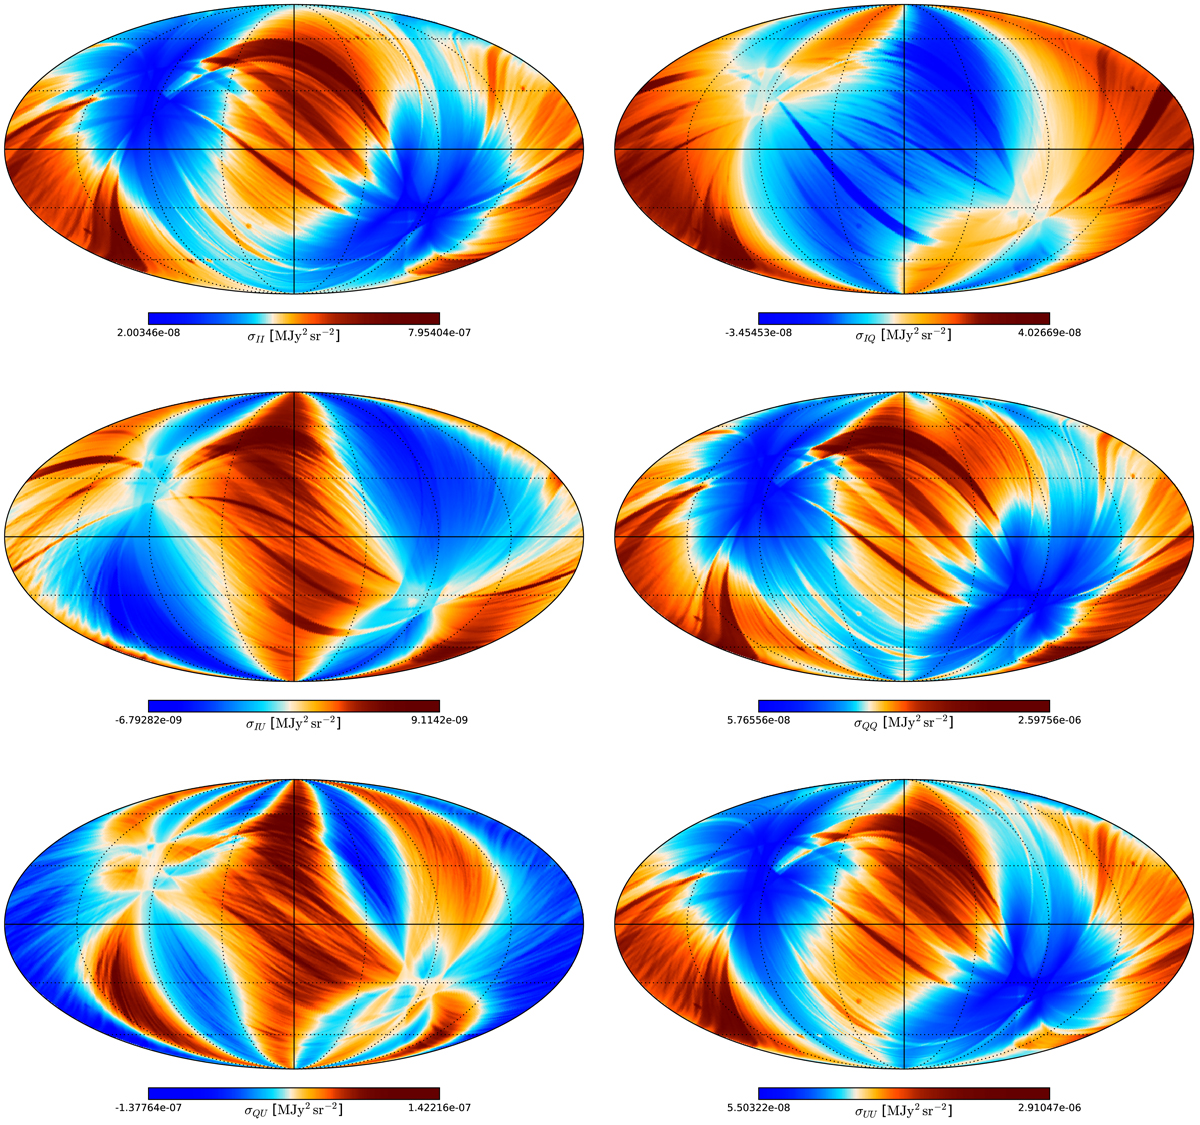
GNILC-processed covariance maps at 353 GHz and unifom 80′ resolution. From top to bottom and left to right, they are σII, σIQ, σIU, σQQ, σQU, and σUU.
Current usage metrics show cumulative count of Article Views (full-text article views including HTML views, PDF and ePub downloads, according to the available data) and Abstracts Views on Vision4Press platform.
Data correspond to usage on the plateform after 2015. The current usage metrics is available 48-96 hours after online publication and is updated daily on week days.
Initial download of the metrics may take a while.