Fig. 25.
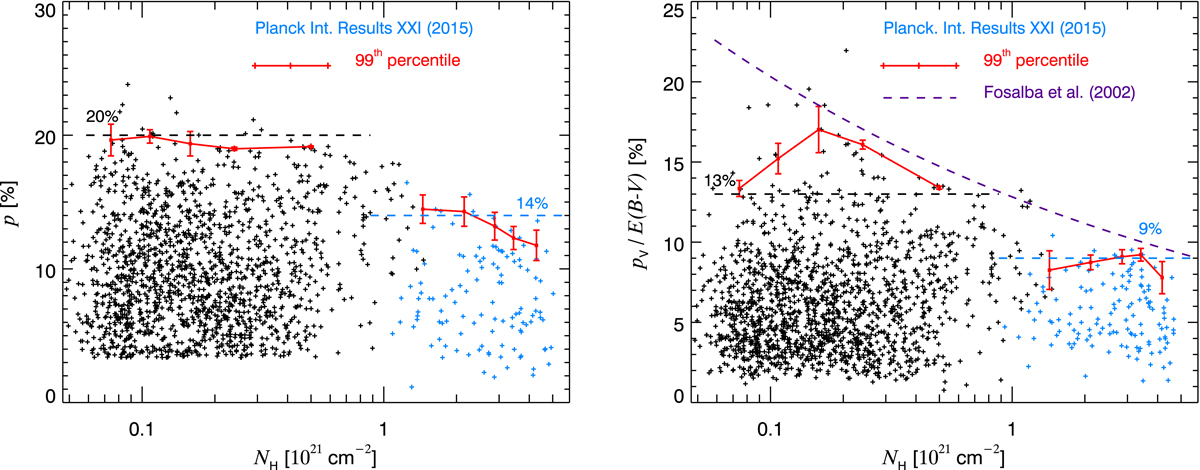
Polarization fraction in emission at 353 GHz, p = P/I (left), and in optical extinction, pV/E(B − V) (right), as a function of the column density, NH. The sample in blue shows the 206 translucent lines of sight from Planck Collaboration Int. XXI (2015), along with the estimates of maximum polarization. The sample in black is the one in our current study (1505 stars), where data have been corrected for systematic effects such as beam depolarization (see Appendix G). For each sample, we plot the 99th percentile in p and pV/E(B − V), along with the uncertainty on the derivation of this percentile (see text). The fit from Fosalba et al. (2002), corresponding to pV/E(B − V) ∝ E(B − V)−0.2, is shown for comparison.
Current usage metrics show cumulative count of Article Views (full-text article views including HTML views, PDF and ePub downloads, according to the available data) and Abstracts Views on Vision4Press platform.
Data correspond to usage on the plateform after 2015. The current usage metrics is available 48-96 hours after online publication and is updated daily on week days.
Initial download of the metrics may take a while.