Fig. 24.
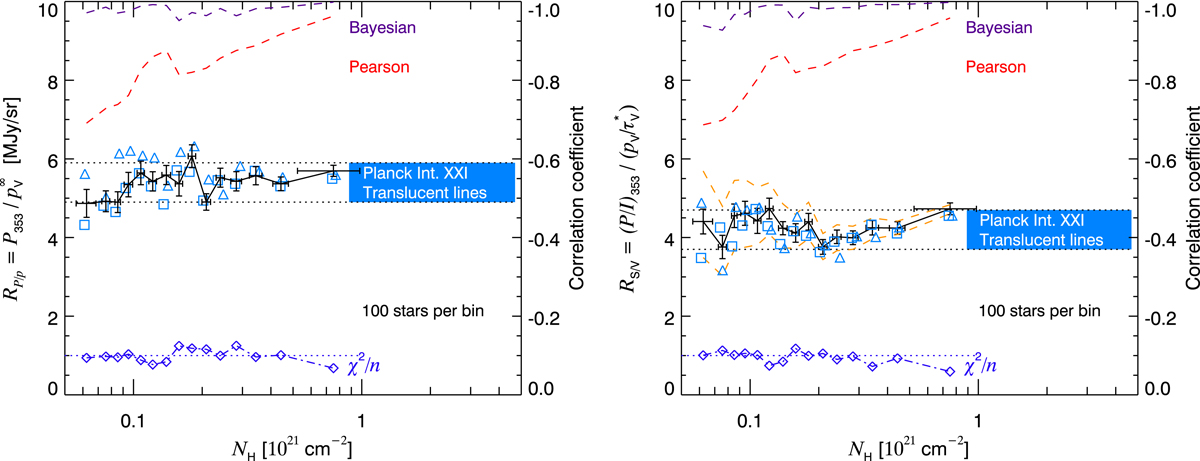
Emission-to-extinction polarization ratios. The black curves show the ratios RP/p (left) and RS/V for the fiducial offset in I (right), at 40′ resolution, as a function of the column density, NH. For the running mean each bin contains the same number (100) of lines of sight. The lower dark blue dotted-dashed lines indicate the reduced χ2 of the fits (with the scale on the left axis). Dashed red and purple curves represent the Pearson and Bayesian (Kelly 2007) correlation coefficients, respectively (with the scale on the right axis). The results at a resolution of 80′ (squares) and 20′ (triangles) are also shown. On the right panel, the upper and lower dashed orange curves represent the trend for the low and high offsets in I, respectively, at the reference resolution of 40′. The blue band shows in each panel the mean value, together with its uncertainty domain, found for the range of column densities considered in Planck Collaboration Int. XXI (2015).
Current usage metrics show cumulative count of Article Views (full-text article views including HTML views, PDF and ePub downloads, according to the available data) and Abstracts Views on Vision4Press platform.
Data correspond to usage on the plateform after 2015. The current usage metrics is available 48-96 hours after online publication and is updated daily on week days.
Initial download of the metrics may take a while.