Fig. 21.
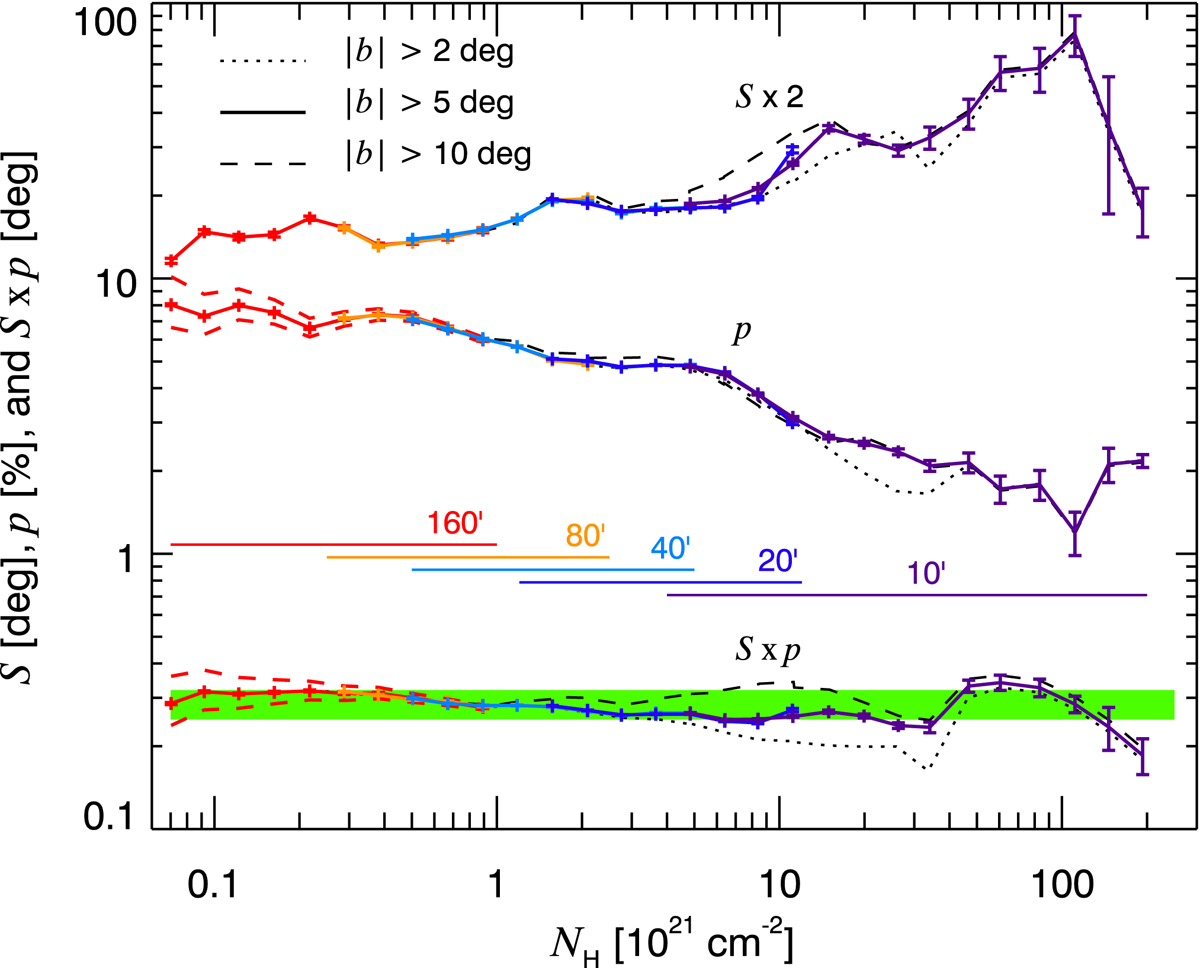
Mean 𝒮, p, and 𝒮 × p as a function of NH, combining results from Planck maps at optimal resolutions for all lines of sight above |b| > 5° (solid curves). For clarity, 𝒮 has been raised vertically by a factor of 2. Upper and lower dashed red curves show the corresponding values using the low and high total intensity offsets, respectively. In contrast to other plots, the running means are computed here for bins of equal logarithmic size, which therefore do not contain the same number of pixels. Error bars correspond to the uncertainty on the mean, ![]() , where σ is the statistical dispersion and n is the number of lines of sight in the corresponding bin. Results of the same analysis with different selection criteria on Galactic latitude are shown by thin black dashed (|b| > 10°) and dotted (|b| > 2°) curves. Horizontal coloured bars indicate for each resolution ω the column density interval ℐ(ω) used in the renormalization procedure (see text). The green band highlights a 25% decrease in 𝒮 × p with column density up to 2 × 1022 cm−2.
, where σ is the statistical dispersion and n is the number of lines of sight in the corresponding bin. Results of the same analysis with different selection criteria on Galactic latitude are shown by thin black dashed (|b| > 10°) and dotted (|b| > 2°) curves. Horizontal coloured bars indicate for each resolution ω the column density interval ℐ(ω) used in the renormalization procedure (see text). The green band highlights a 25% decrease in 𝒮 × p with column density up to 2 × 1022 cm−2.
Current usage metrics show cumulative count of Article Views (full-text article views including HTML views, PDF and ePub downloads, according to the available data) and Abstracts Views on Vision4Press platform.
Data correspond to usage on the plateform after 2015. The current usage metrics is available 48-96 hours after online publication and is updated daily on week days.
Initial download of the metrics may take a while.