Fig. 20.
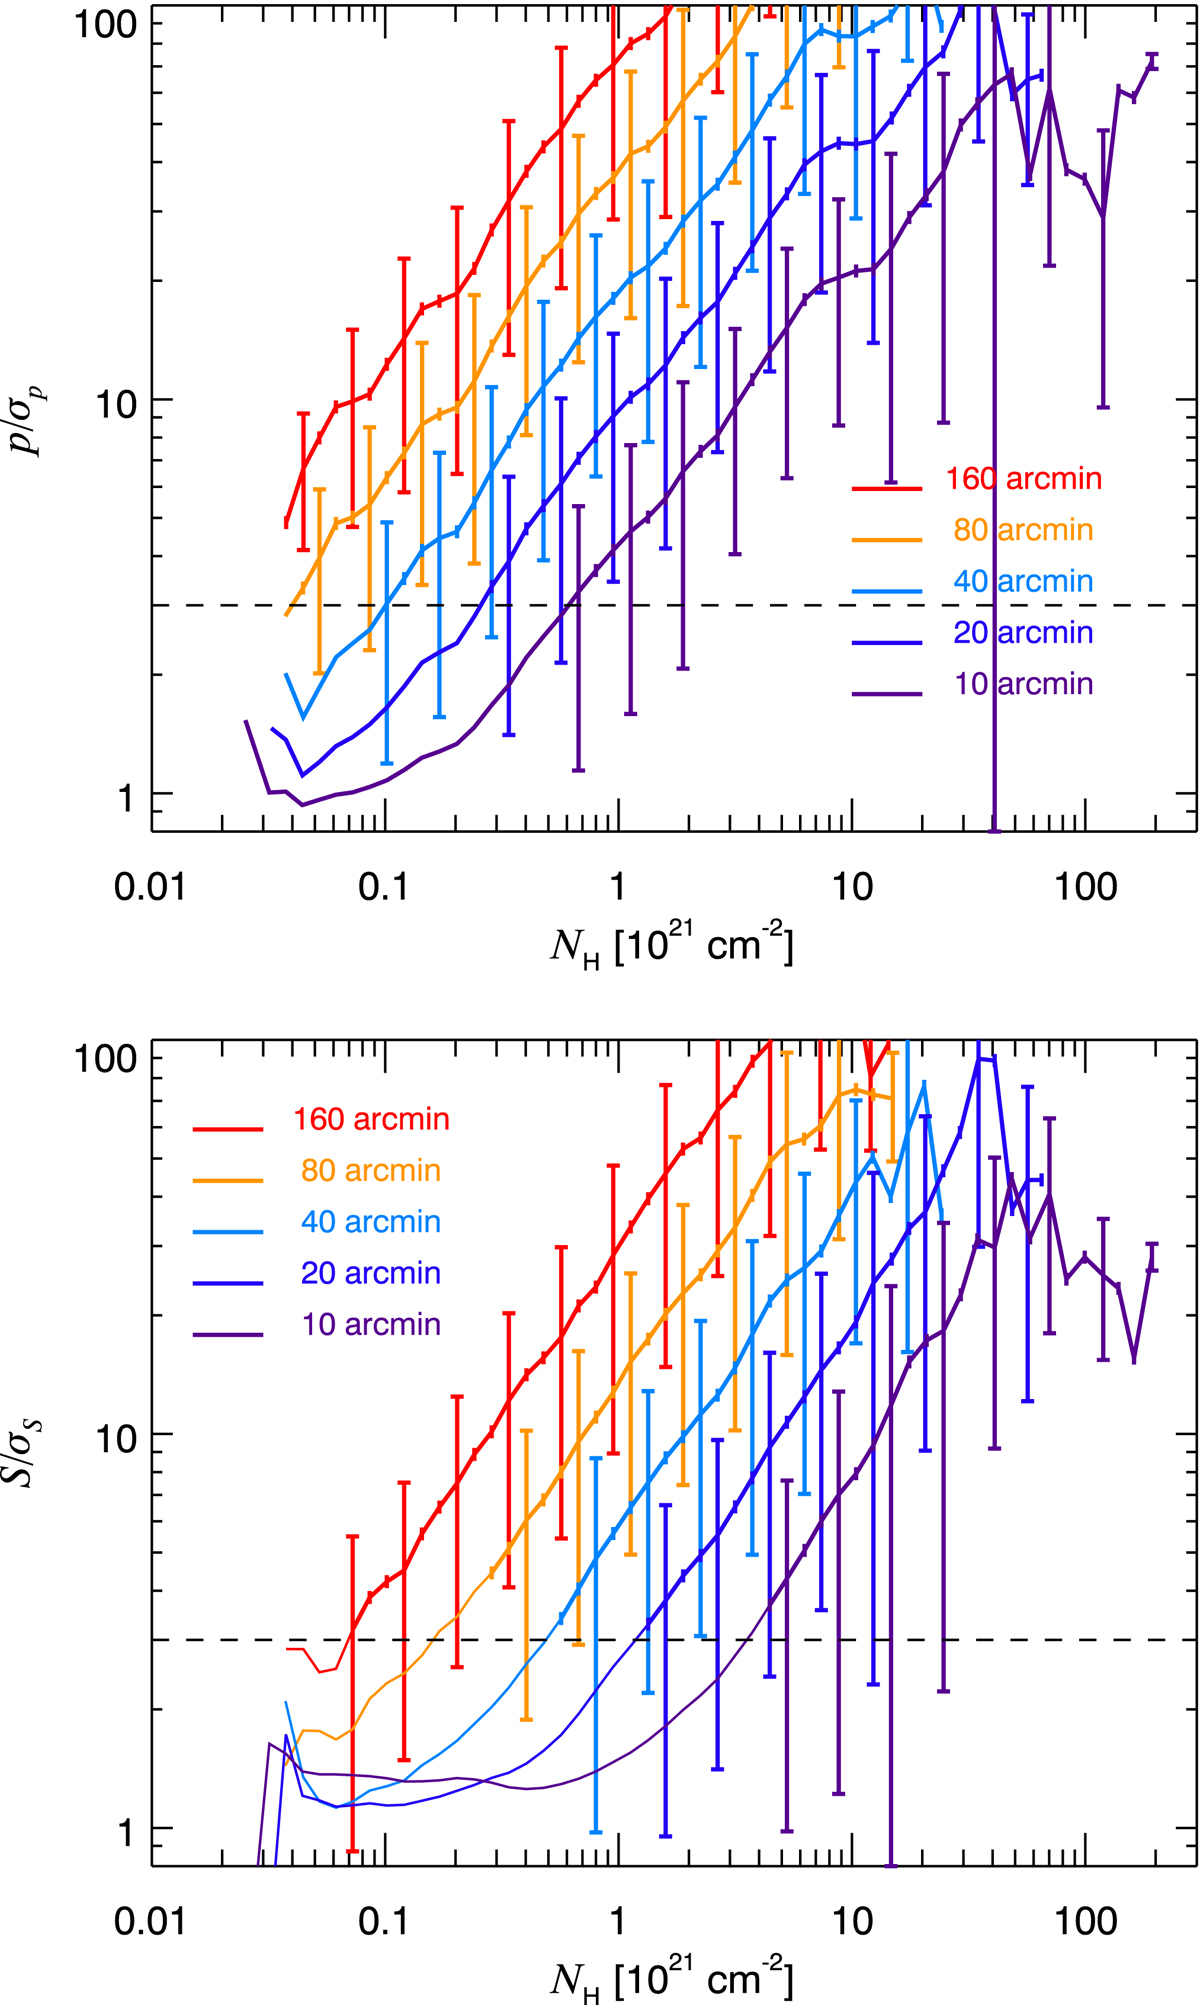
Mean S/N of p (top), and 𝒮 (bottom) as a function of NH, for various resolutions, over the full sky (excluding the Galactic plane, |b| > 5°). Error bars correspond to the scatter in each bin, not to the uncertainty on the mean. The dashed line indicates the minimal S/N that ensures reliable mean values for debiased quantities.
Current usage metrics show cumulative count of Article Views (full-text article views including HTML views, PDF and ePub downloads, according to the available data) and Abstracts Views on Vision4Press platform.
Data correspond to usage on the plateform after 2015. The current usage metrics is available 48-96 hours after online publication and is updated daily on week days.
Initial download of the metrics may take a while.