Fig. 2.
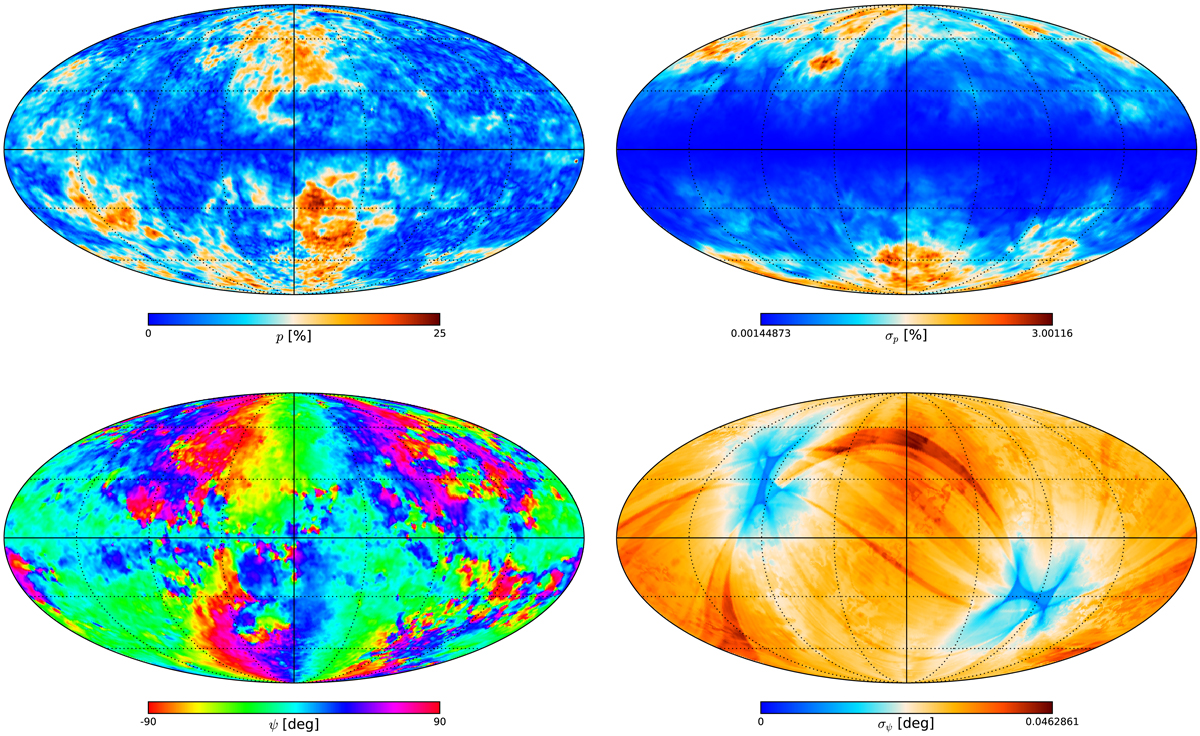
Polarization maps for the GNILC-processed data at 353 GHz and uniform 80′ resolution: polarization fraction p (top left) and associated statistical uncertainty σp (top right), polarization angle ψ (bottom left) and associated statistical uncertainty σψ (bottom right). The pattern in the σψ map arises from the Planck scanning strategy.
Current usage metrics show cumulative count of Article Views (full-text article views including HTML views, PDF and ePub downloads, according to the available data) and Abstracts Views on Vision4Press platform.
Data correspond to usage on the plateform after 2015. The current usage metrics is available 48-96 hours after online publication and is updated daily on week days.
Initial download of the metrics may take a while.