Open Access
Fig. 18.
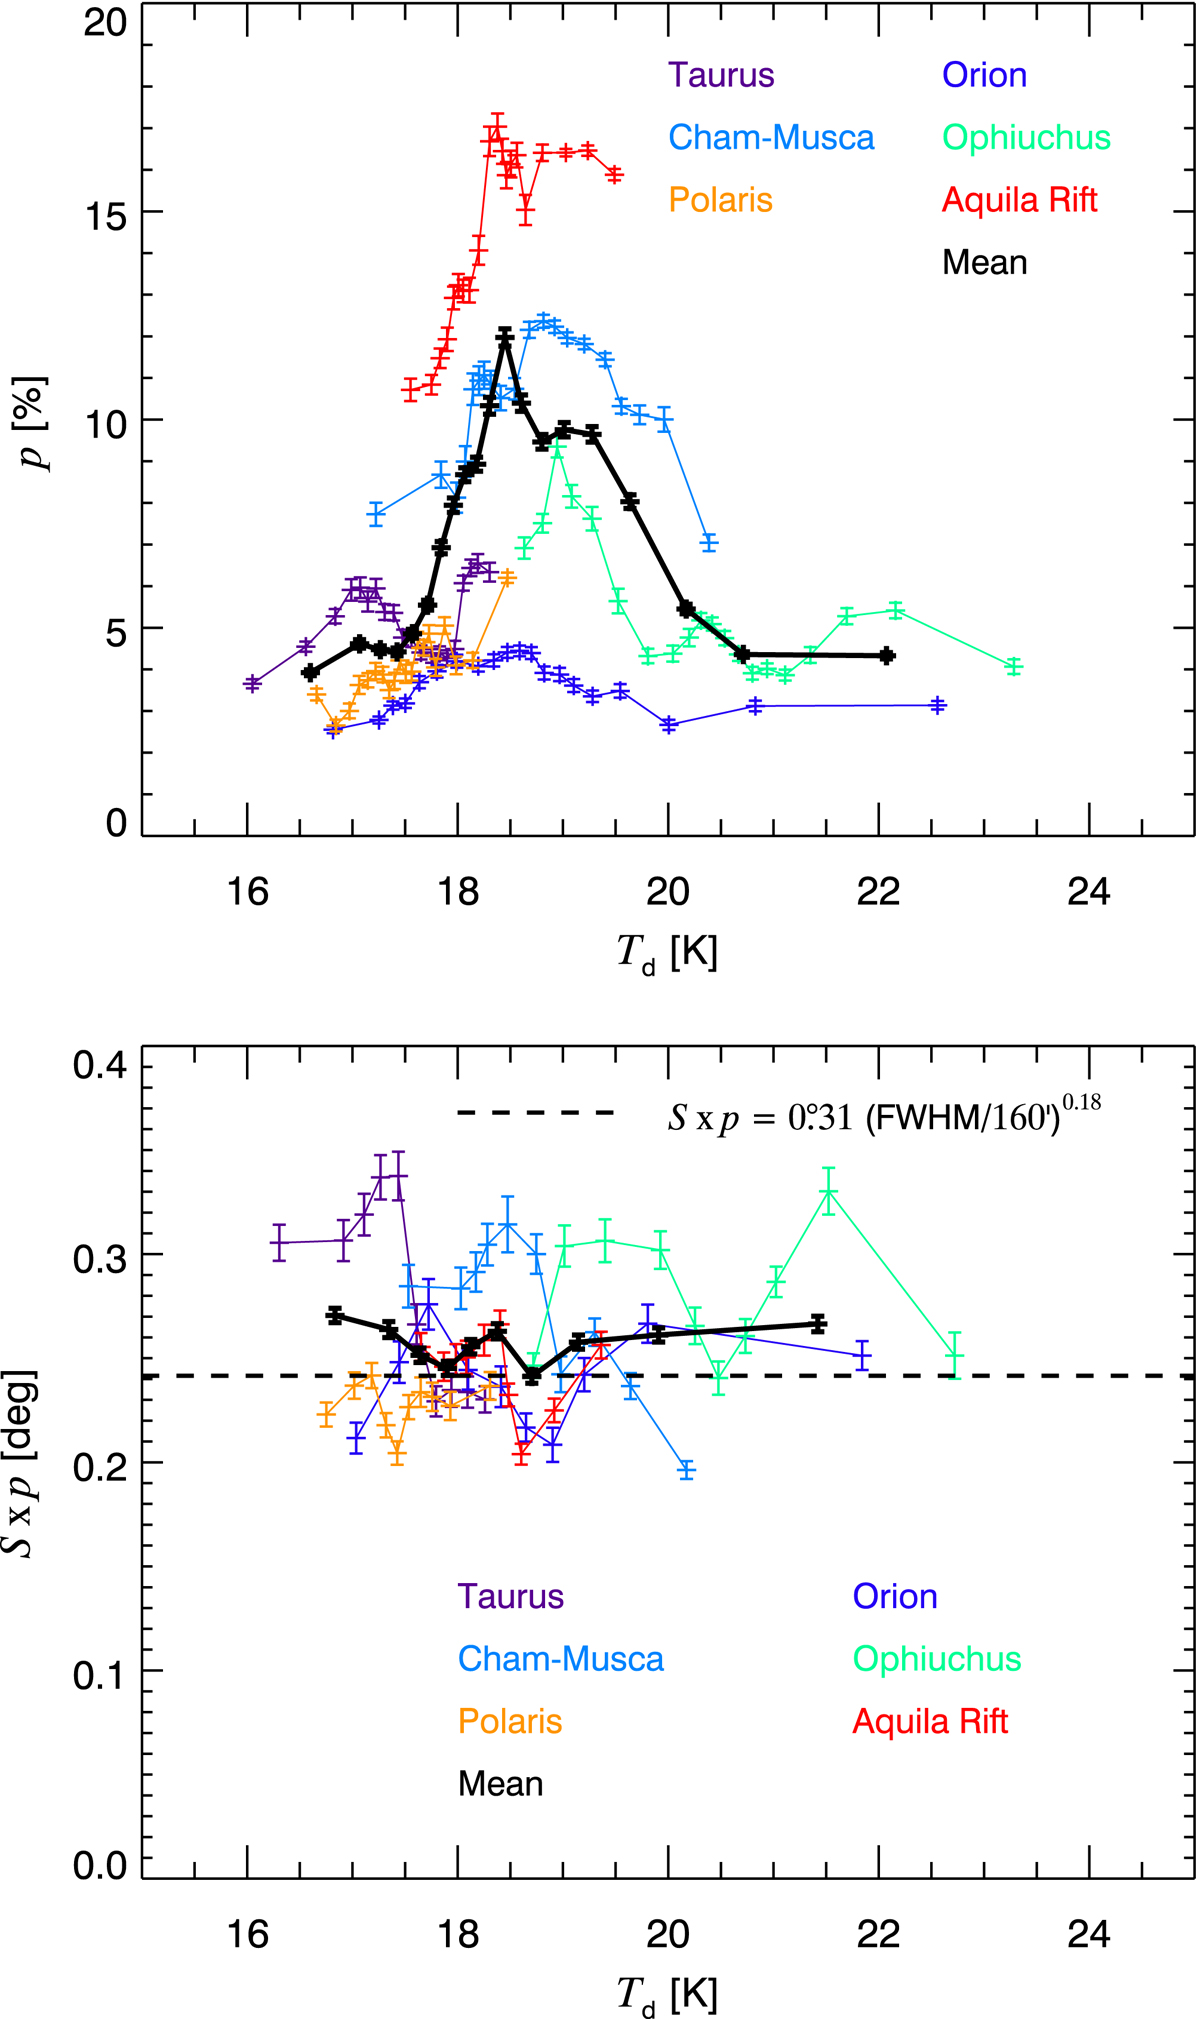
Polarization fraction at 353 GHz (top) and product 𝒮 × p (bottom) as a function of dust temperature, at a resolution of 40′. The black curve indicates the mean trend averaged over all regions. The dashed horizontal line is the mean value of 𝒮 × p at 160′ (Fig. 10), corrected for its dependence on the lag (Eq. (10)).
Current usage metrics show cumulative count of Article Views (full-text article views including HTML views, PDF and ePub downloads, according to the available data) and Abstracts Views on Vision4Press platform.
Data correspond to usage on the plateform after 2015. The current usage metrics is available 48-96 hours after online publication and is updated daily on week days.
Initial download of the metrics may take a while.