Open Access
Fig. 17.
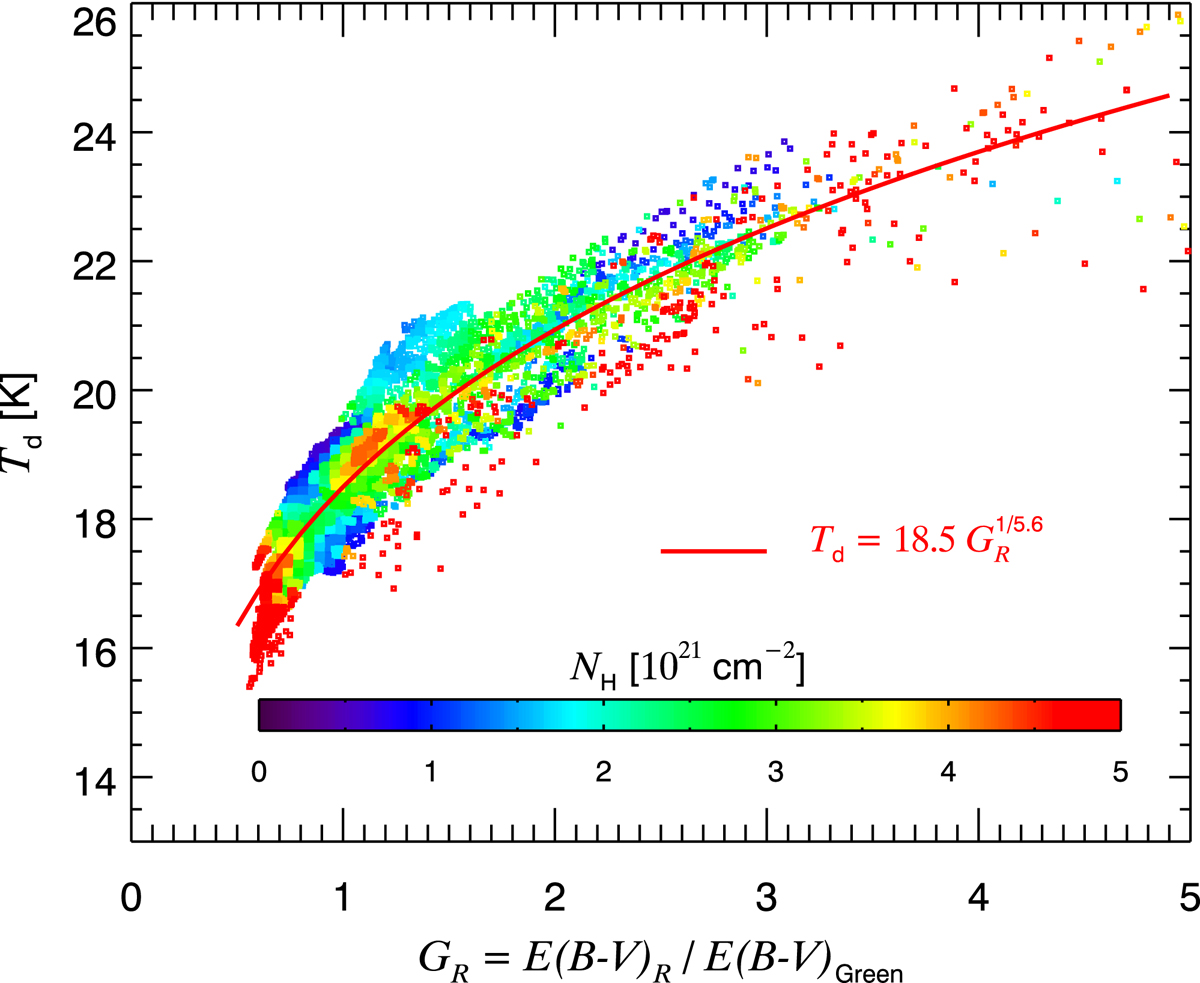
Correlation between dust temperature Td and our estimate Gℛ for the radiation field intensity, in the selected regions, coloured by NH, and for pixels with NH < 5 × 1021 cm−2. The red curve is a prediction for a simple model of dust (see text).
Current usage metrics show cumulative count of Article Views (full-text article views including HTML views, PDF and ePub downloads, according to the available data) and Abstracts Views on Vision4Press platform.
Data correspond to usage on the plateform after 2015. The current usage metrics is available 48-96 hours after online publication and is updated daily on week days.
Initial download of the metrics may take a while.