Fig. 16.
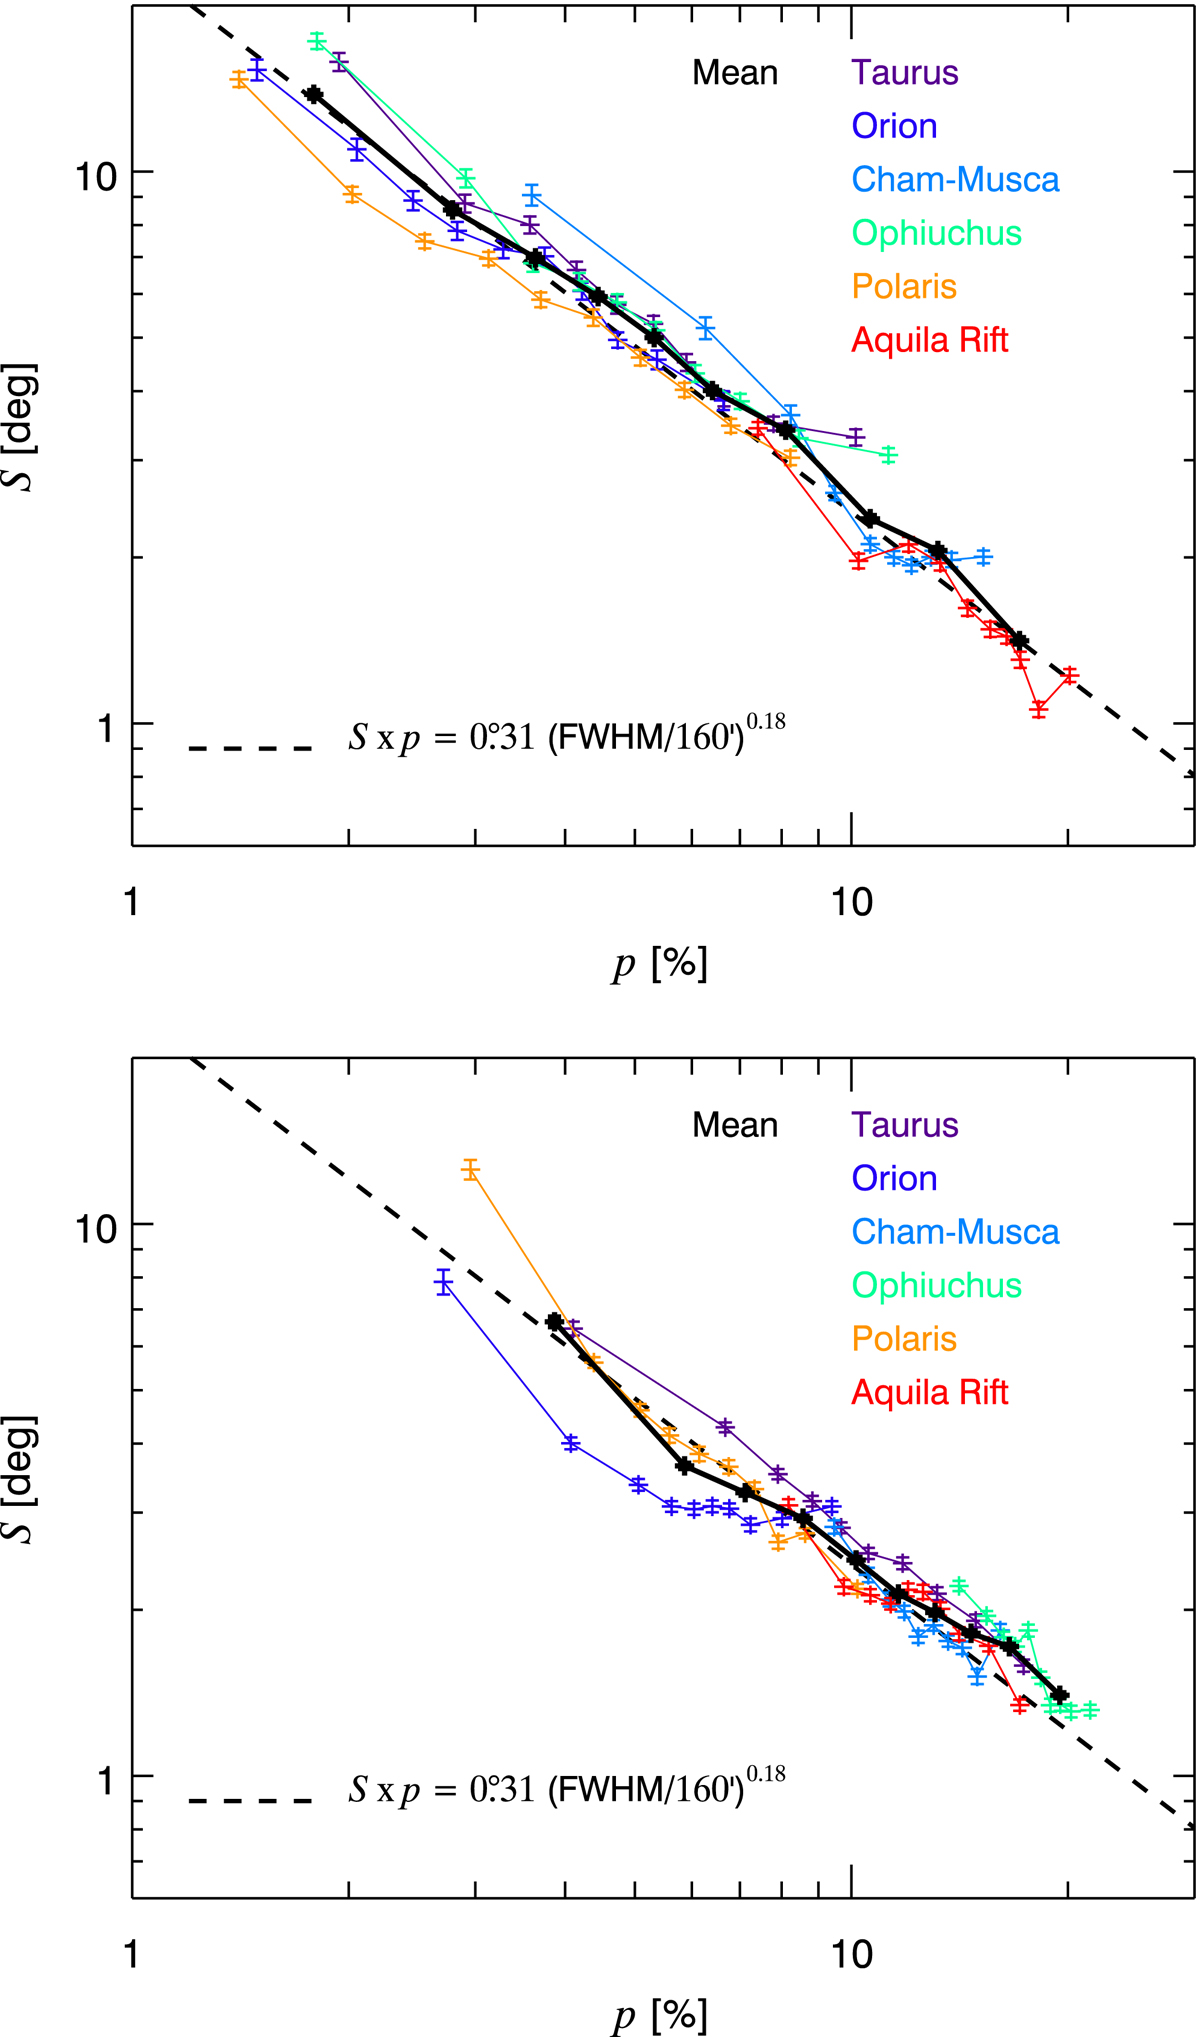
Mean 𝒮 as a function of p in selected regions in the Gould Belt for the Planck data (top) and for our phenomenological model (bottom, see text), at a resolution of 40′. The black curve indicates the mean trend averaged over all regions. The dashed line is the fit to the mean 𝒮 = f(p) trend at 160′ (Fig. 10), corrected for its dependence on the resolution, as per Eq. (10). All bins in p contain the same number of pixels, n ≈ 250. Error bars correspond to the uncertainty on the mean, i.e., ![]() , where σ is the statistical dispersion in the corresponding bin.
, where σ is the statistical dispersion in the corresponding bin.
Current usage metrics show cumulative count of Article Views (full-text article views including HTML views, PDF and ePub downloads, according to the available data) and Abstracts Views on Vision4Press platform.
Data correspond to usage on the plateform after 2015. The current usage metrics is available 48-96 hours after online publication and is updated daily on week days.
Initial download of the metrics may take a while.