Fig. 14.
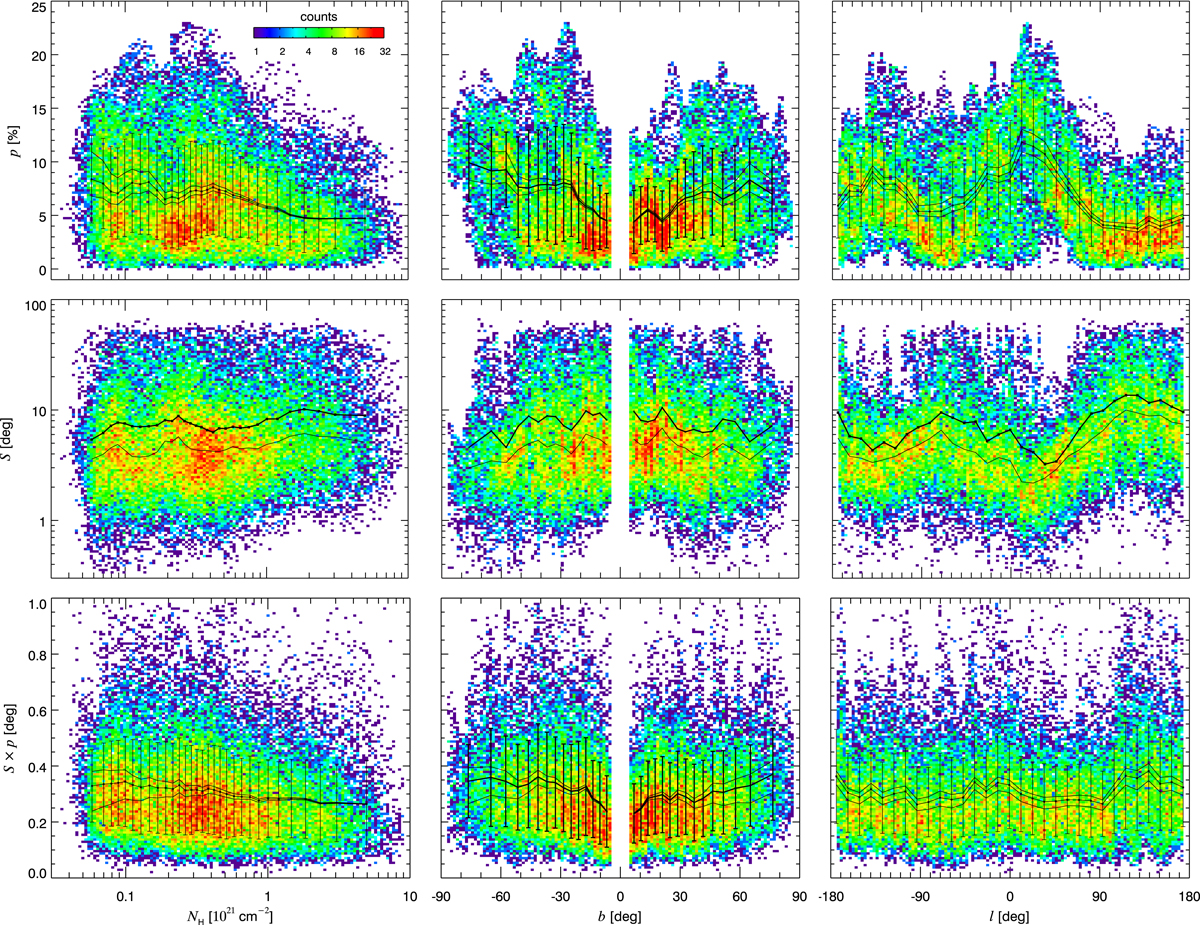
Two-dimensional histograms with background colours encoding the density of points on a logarithmic scale, showing p (top), 𝒮 (middle), and 𝒮 × p (bottom) as a function of the column density NH (left), Galactic latitude b (middle), and Galactic longitude l (right). The resolution is 160′. The colour bar shown in the top left panel is common to all plots. Black curves show the running means calculated as in Fig. 12, with error bars representing the scatter in each bin. For 𝒮, which is on a logarithmic scale, the median trend shown (thin black line) follows the density of points more faithfully than does the mean (thicker black line).
Current usage metrics show cumulative count of Article Views (full-text article views including HTML views, PDF and ePub downloads, according to the available data) and Abstracts Views on Vision4Press platform.
Data correspond to usage on the plateform after 2015. The current usage metrics is available 48-96 hours after online publication and is updated daily on week days.
Initial download of the metrics may take a while.