Fig. 10.
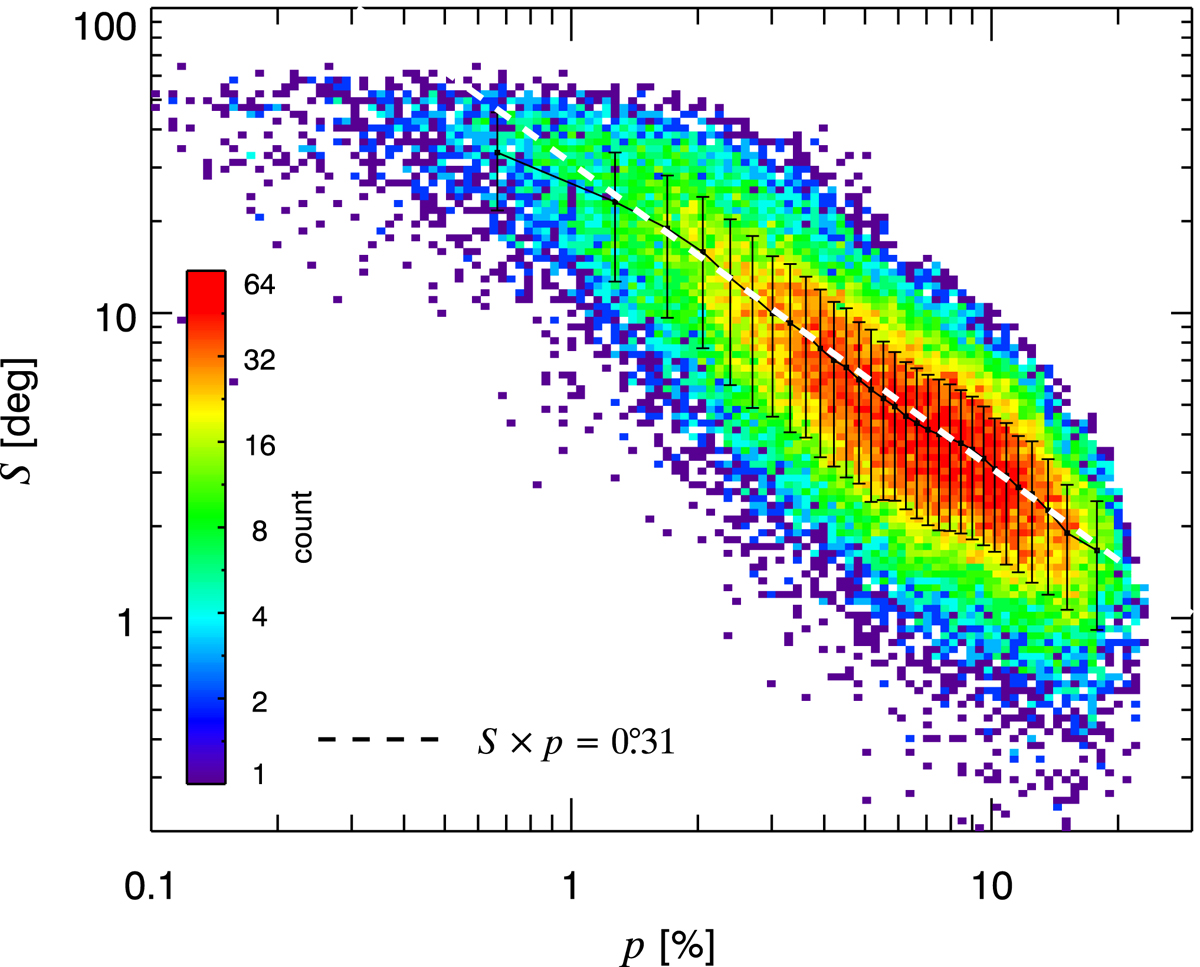
Two-dimensional histogram showing the joint distribution function of 𝒮 and p at 160′ resolution, using a lag δ = 80′. The black curve is the running mean of 𝒮 as a function of the mean p, in bins of ordered p, with each bin containing the same number of pixels. The error bars represent the standard deviation of 𝒮 in each bin of p. The dashed white line shows our fit 𝒮 = 0![]() 31/p to this running mean.
31/p to this running mean.
Current usage metrics show cumulative count of Article Views (full-text article views including HTML views, PDF and ePub downloads, according to the available data) and Abstracts Views on Vision4Press platform.
Data correspond to usage on the plateform after 2015. The current usage metrics is available 48-96 hours after online publication and is updated daily on week days.
Initial download of the metrics may take a while.