Fig. 50.
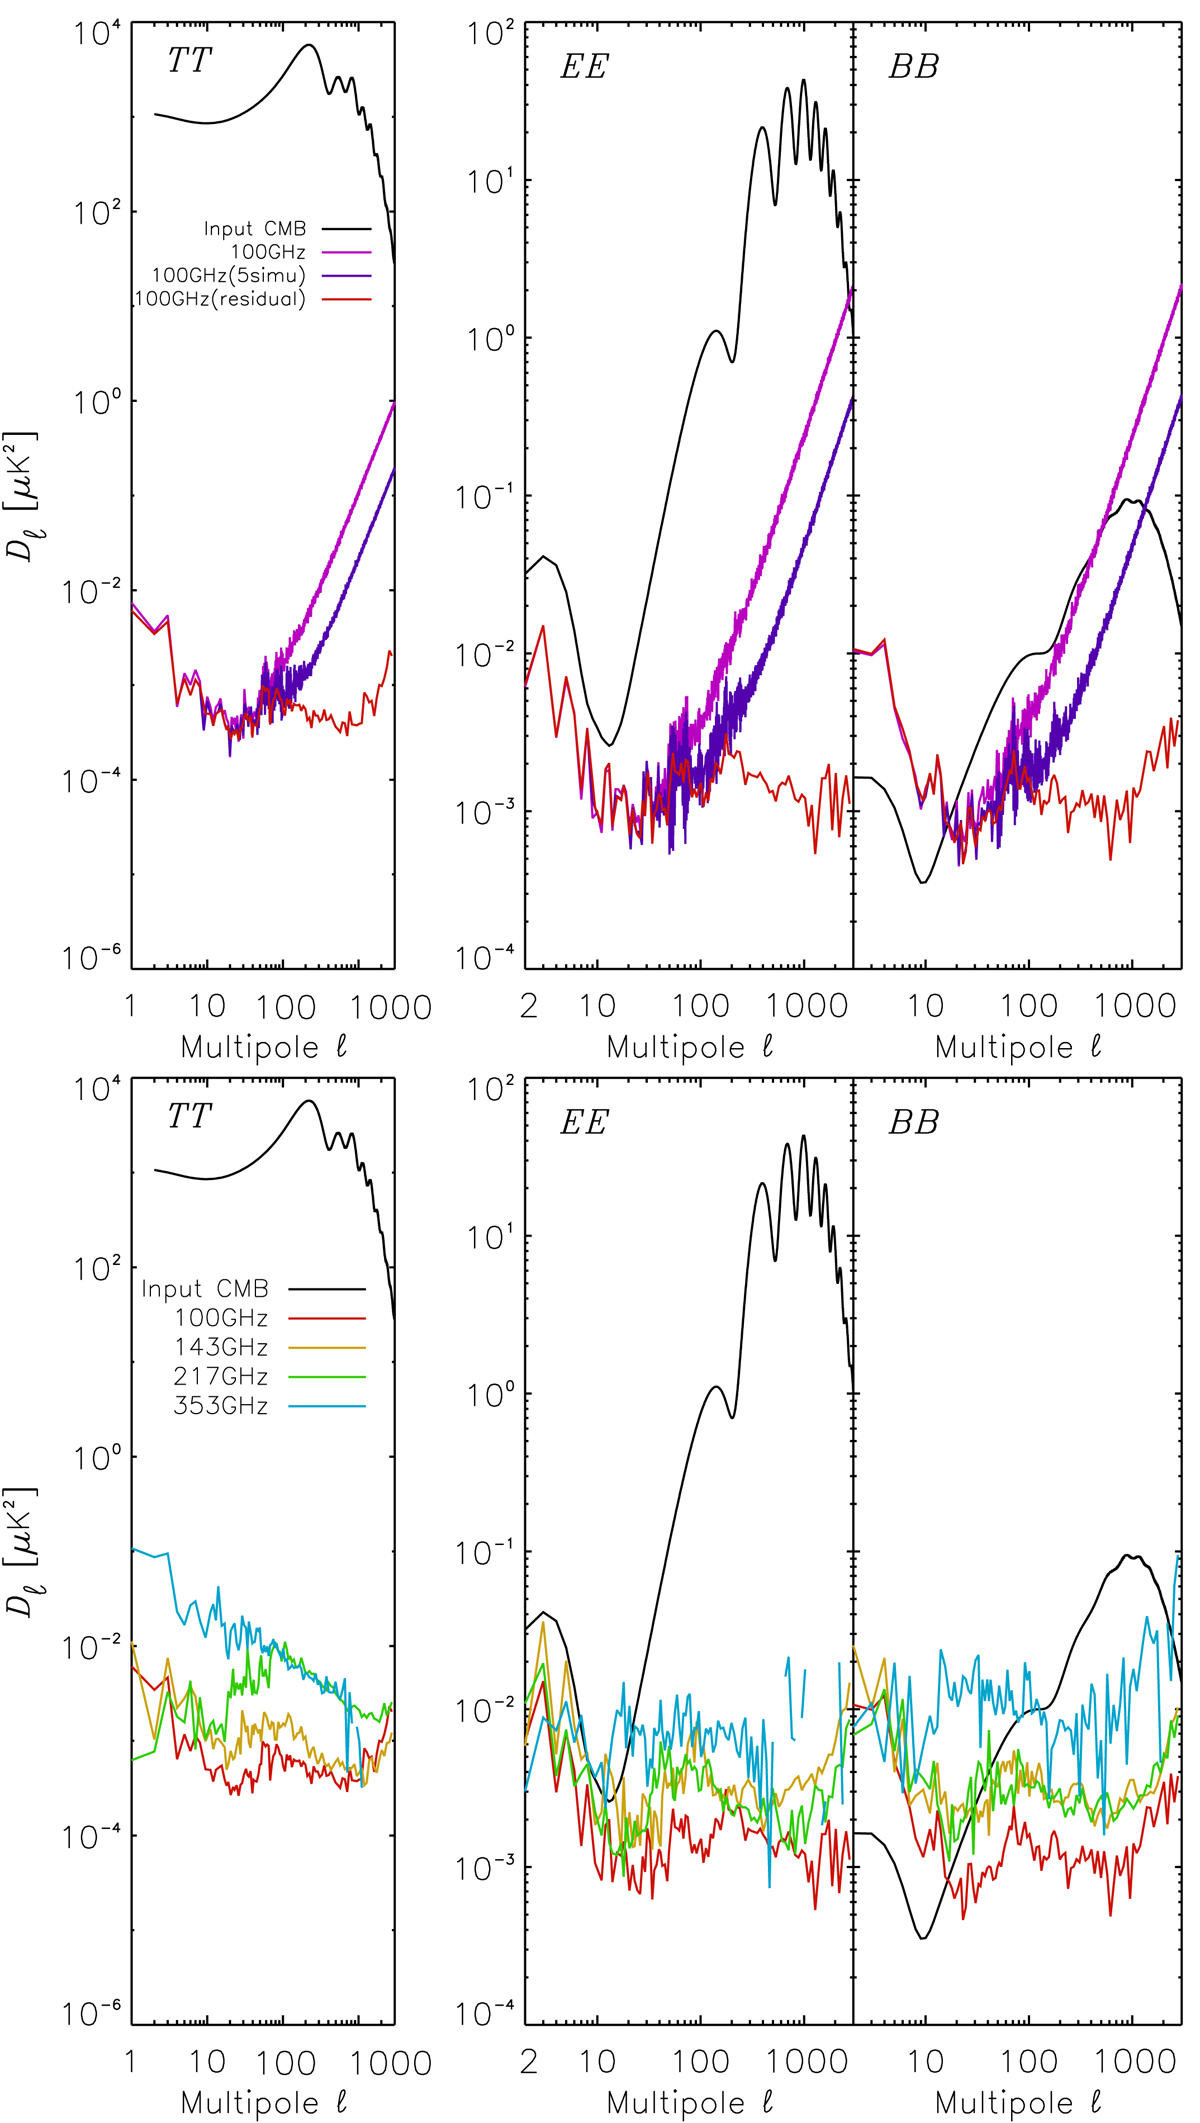
Top panels: residual auto-spectra of the ADCNL at 100 GHz, for a single simulation (purple line), after correction by the gain variation model. An average over five realizations is shown as the blue line. Using the difference, and scaling it as Gaussian noise for one simulation, we then subtract it from the single simulation (purple). The red curve shows the residuals when removing this estimate of the noise. Bottom panels: the residuals for the four frequencies.
Current usage metrics show cumulative count of Article Views (full-text article views including HTML views, PDF and ePub downloads, according to the available data) and Abstracts Views on Vision4Press platform.
Data correspond to usage on the plateform after 2015. The current usage metrics is available 48-96 hours after online publication and is updated daily on week days.
Initial download of the metrics may take a while.