Fig. 49.
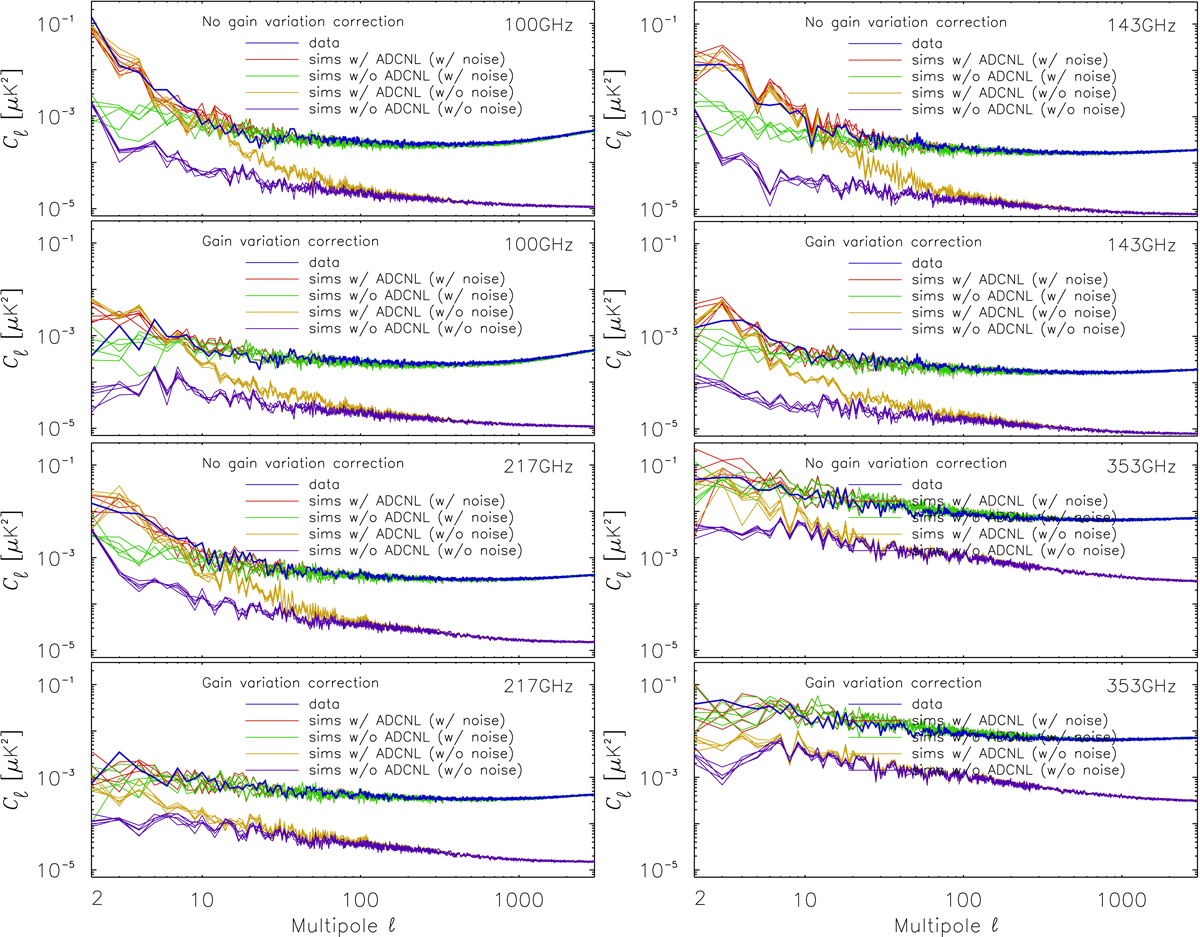
For each frequency, EE power spectra are presented for the half-mission null-test difference maps, with and without noise. The plots show the data and five realizations of the ADCNL simulation: red with ADCNL and noise; orange with ADCNL without noise; green without ADCNL, but with noise; and purple without ADCNL, and without noise (residuals from other systematics). In the upper panels, no ADCNL correction has been carried out in the mapmaking, while in the lower panels, the time-varying gain correction has been applied. The simulations are also carried out without ADCNL.
Current usage metrics show cumulative count of Article Views (full-text article views including HTML views, PDF and ePub downloads, according to the available data) and Abstracts Views on Vision4Press platform.
Data correspond to usage on the plateform after 2015. The current usage metrics is available 48-96 hours after online publication and is updated daily on week days.
Initial download of the metrics may take a while.