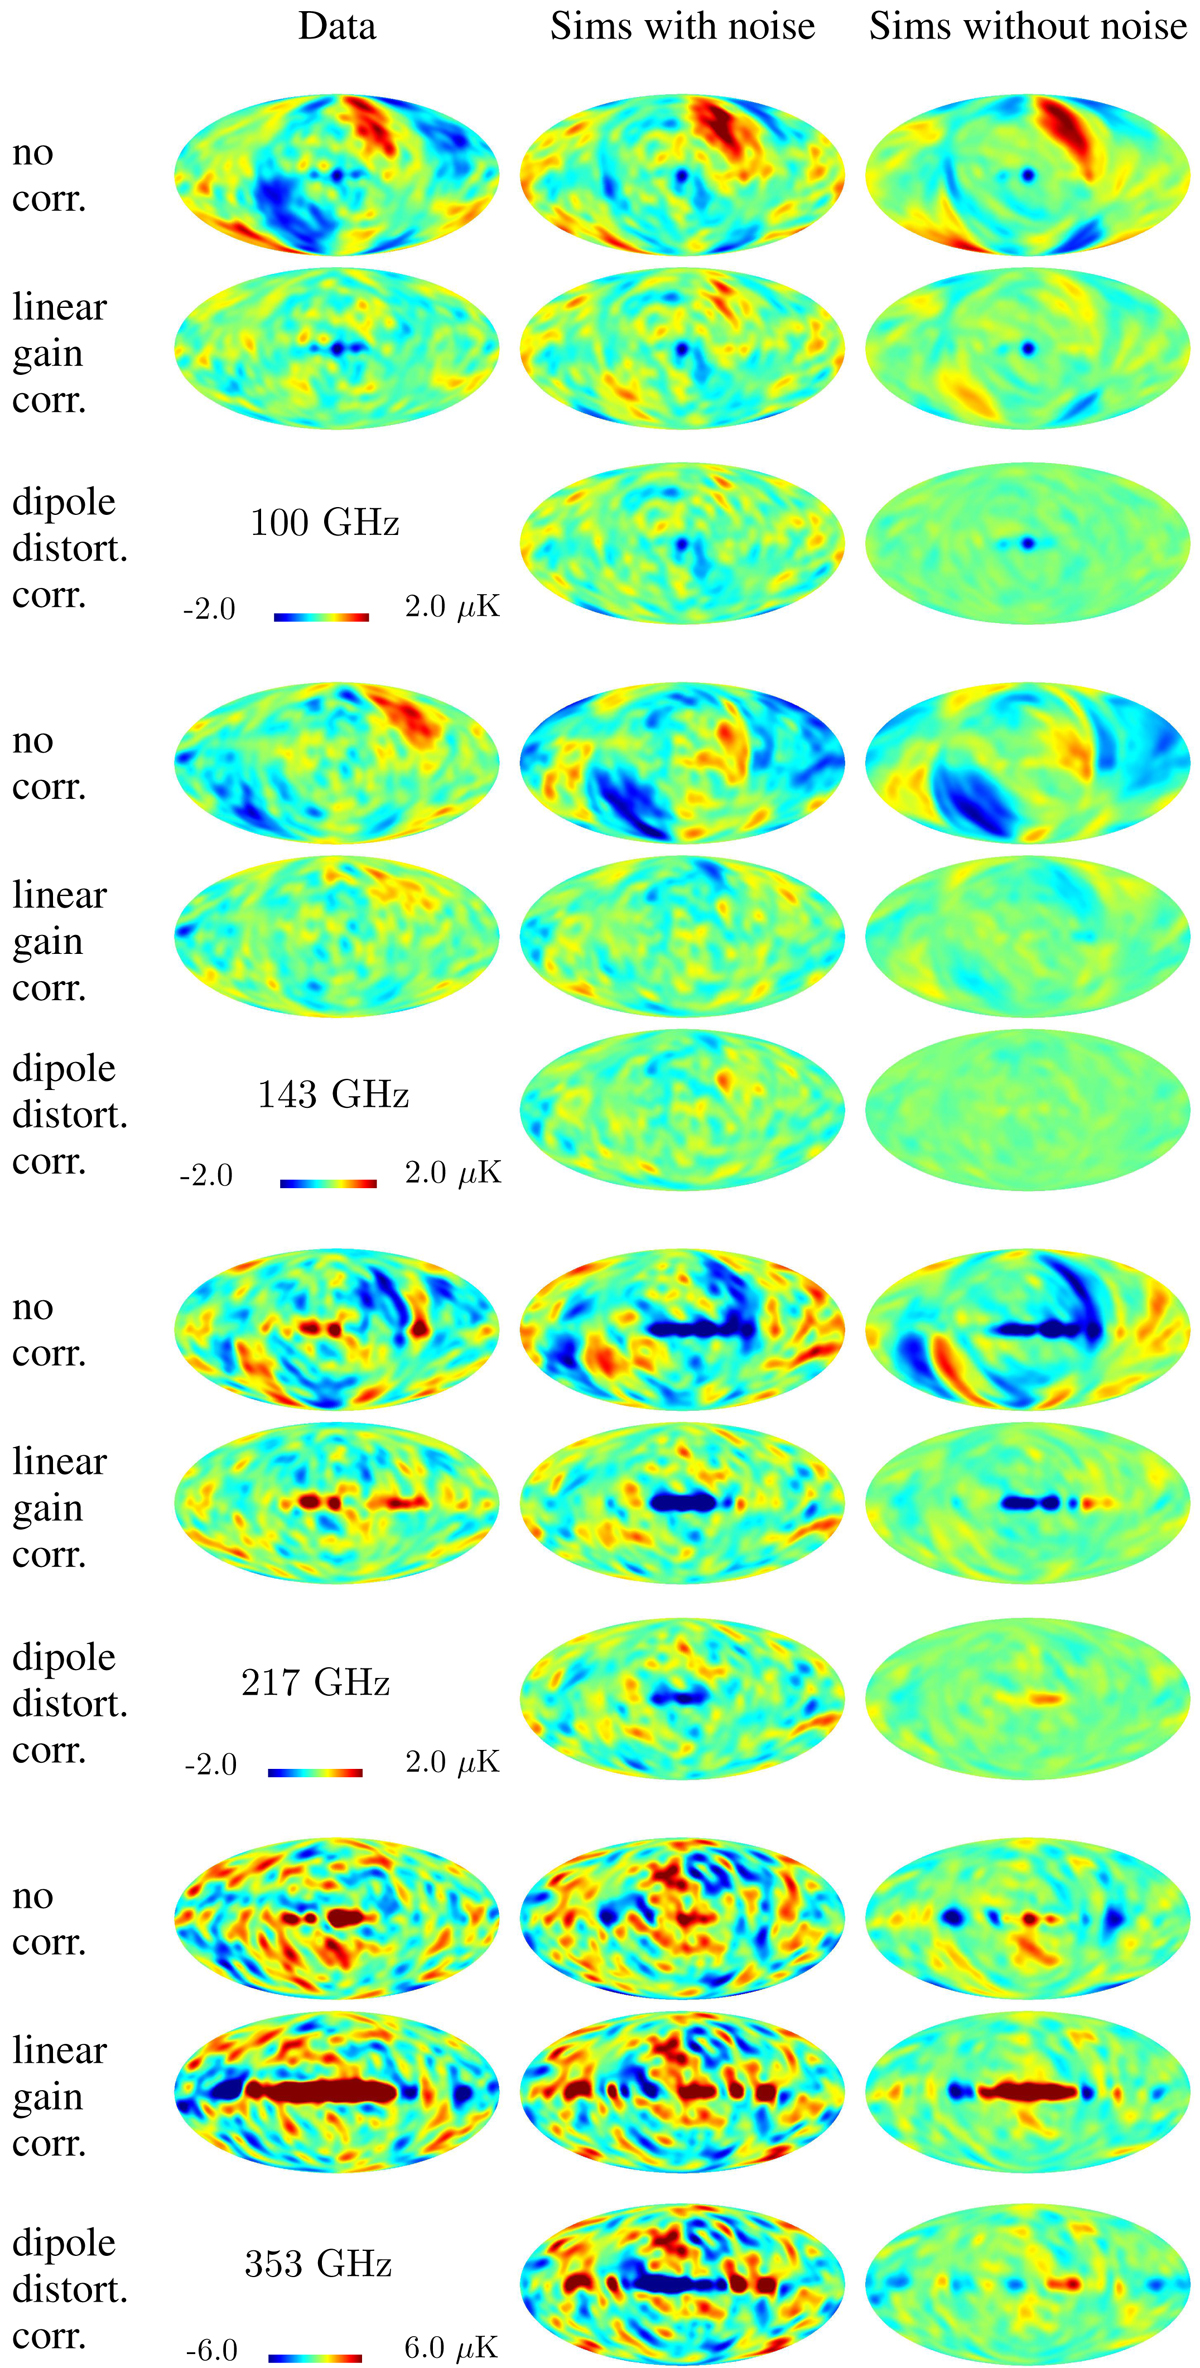
Fig. 48.

For each of the four frequencies, we show eight Q maps. The first row contains data (left column) and one realization of simulation of the ADCNL with noise (centre column) and without noise included (right column). The second row contains the same after correction for the ADCNL linear gain variation. The third row for each frequency contains simulations carried out without including the ADCNL. With the strong ADCNL signal (especially the dipole part) absent, these show the noise plus other systematics (centre) and just the systematics (right).
Current usage metrics show cumulative count of Article Views (full-text article views including HTML views, PDF and ePub downloads, according to the available data) and Abstracts Views on Vision4Press platform.
Data correspond to usage on the plateform after 2015. The current usage metrics is available 48-96 hours after online publication and is updated daily on week days.
Initial download of the metrics may take a while.


