Fig. 45.
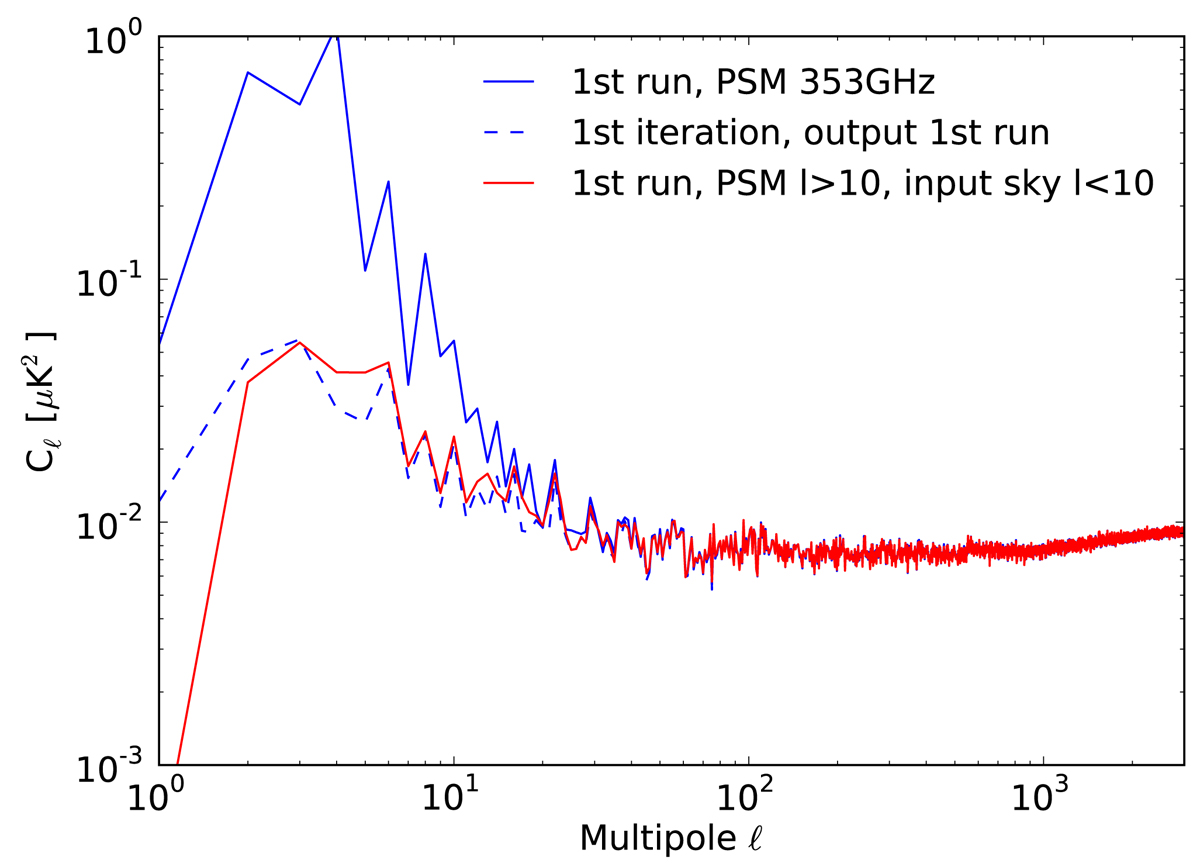
Power spectra of the difference between the template dust input and output 353 GHz Q maps. The solid blue line shows a random PSM input dust template. The dashed blue line shows the case where the input dust template to SRoll has been taken as the output of the first run. The red curve is obtained by replacing the first ten multipoles in the initial dust template by those of the input sky map.
Current usage metrics show cumulative count of Article Views (full-text article views including HTML views, PDF and ePub downloads, according to the available data) and Abstracts Views on Vision4Press platform.
Data correspond to usage on the plateform after 2015. The current usage metrics is available 48-96 hours after online publication and is updated daily on week days.
Initial download of the metrics may take a while.