Fig. 22.
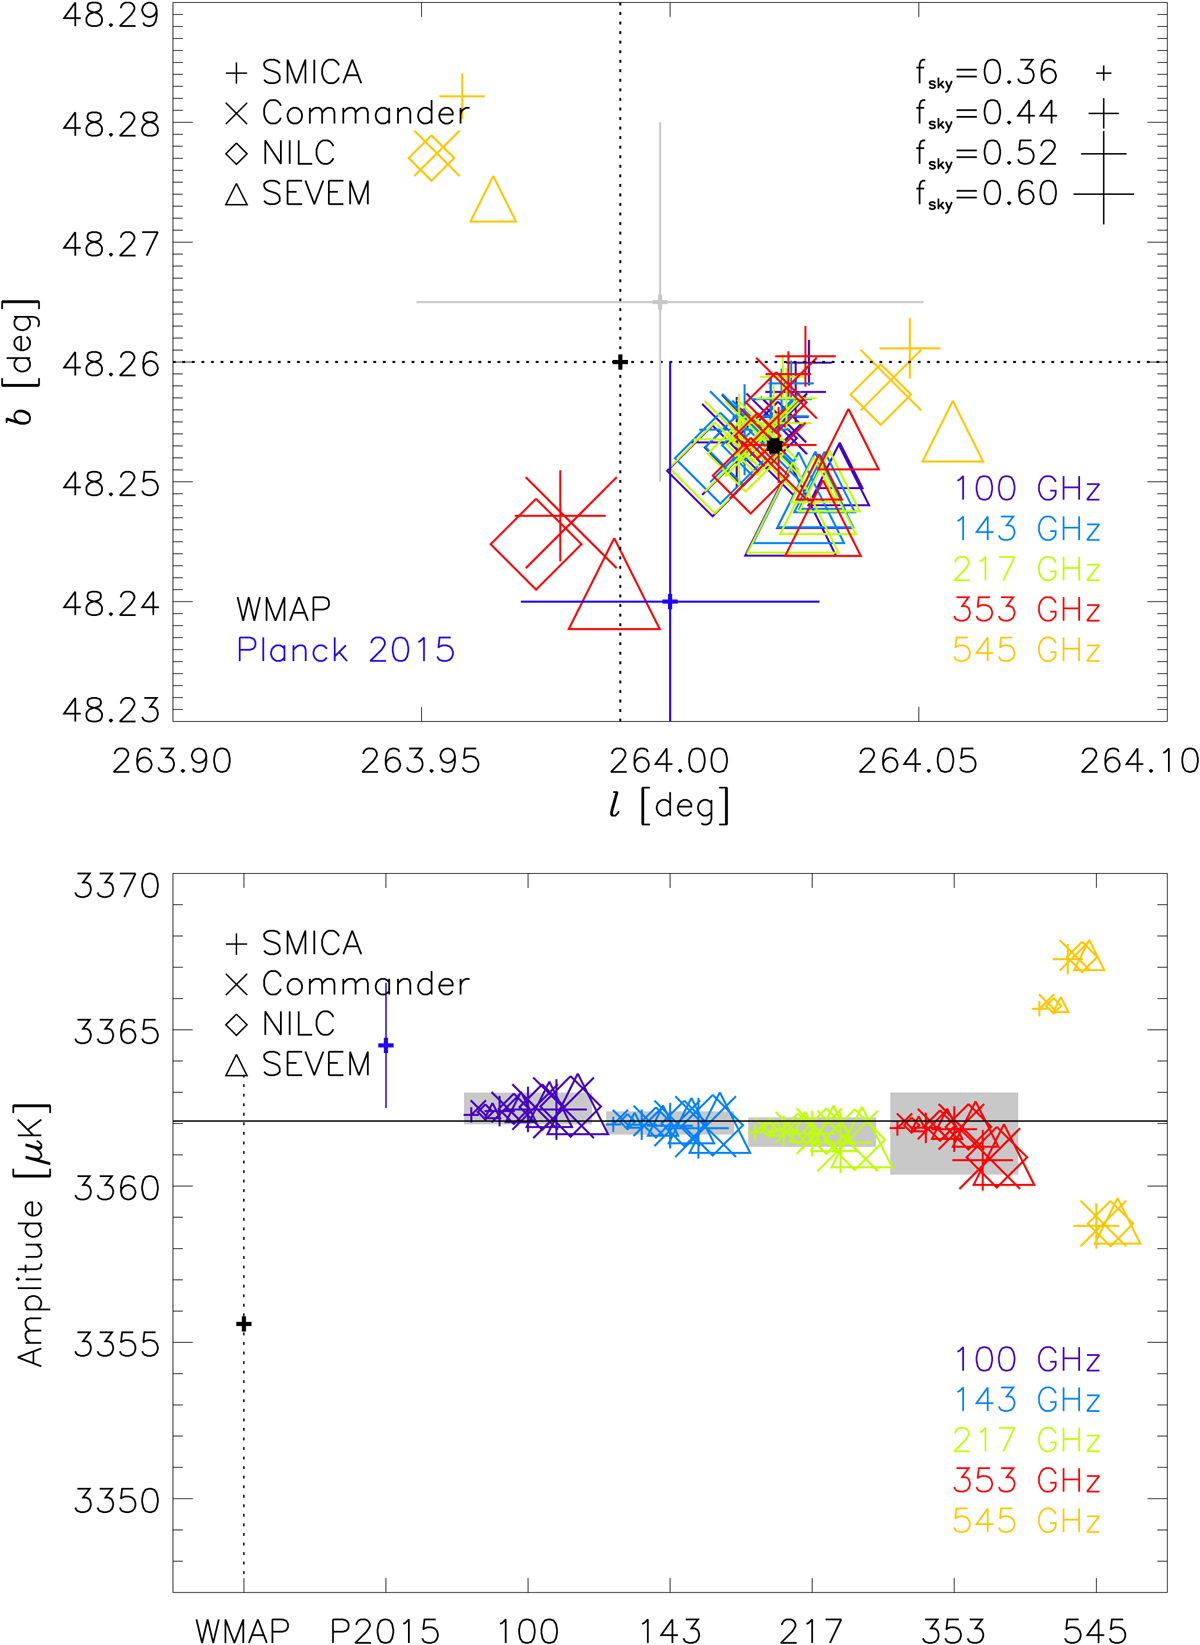
Solar dipole directions and amplitudes for the four component-separation methods using different symbols of size, increasing with sky fraction. The colours refer to frequencies for the 2018 release, while the WMAP measurement (see text) is the black dotted plus sign and the Planck 2015 measurement is the blue one. Grey boxes give the absolute bias uncertainties. At 545 GHz, several points for the largest sky fraction fall outside of the plotted range. The HFI 2018 Solar dipole determination is shown in direction by the black dot and in amplitude by the black horizontal line.
Current usage metrics show cumulative count of Article Views (full-text article views including HTML views, PDF and ePub downloads, according to the available data) and Abstracts Views on Vision4Press platform.
Data correspond to usage on the plateform after 2015. The current usage metrics is available 48-96 hours after online publication and is updated daily on week days.
Initial download of the metrics may take a while.