Fig. 10.
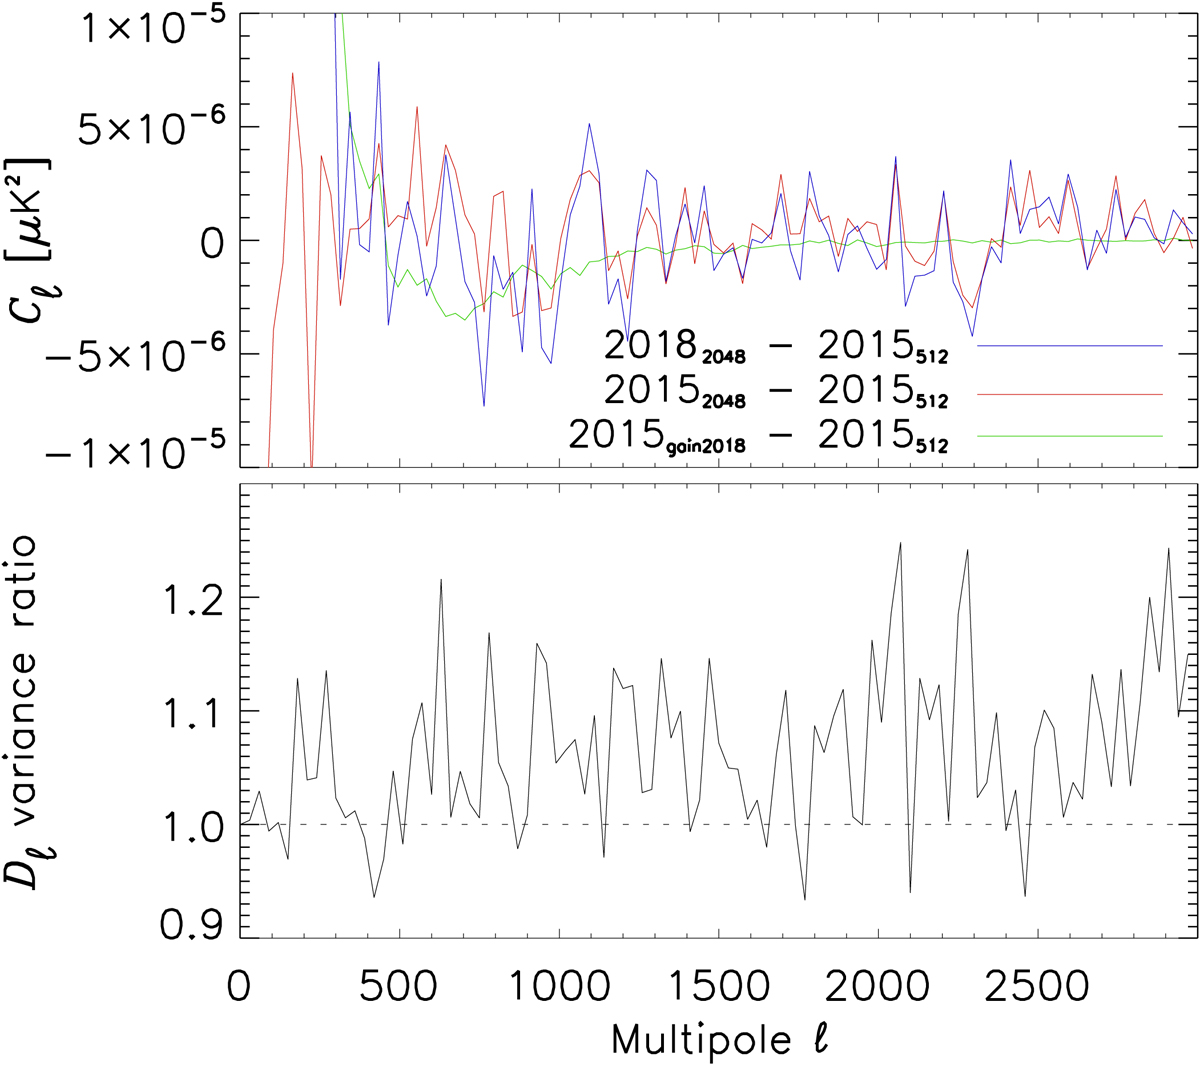
Top panel: the blue curve shows the difference between 143hm1 × 143hm2 cross-spectra between the 2015 (destriped at Nside = 512) and 2018 (destriped at Nside = 2048) data. The red curve shows the difference between the 2015 solution destripped at Nside = 512 and at Nside = 2048. The green curve shows the improvement brought to the 2015 data by the use of the better 2018 gain solution keeping the destriping at Nside = 512. Bottom panel: associated level of improvement of the variance ratio between the destriped 2015 data at Nside = 512 and Nside = 2048.
Current usage metrics show cumulative count of Article Views (full-text article views including HTML views, PDF and ePub downloads, according to the available data) and Abstracts Views on Vision4Press platform.
Data correspond to usage on the plateform after 2015. The current usage metrics is available 48-96 hours after online publication and is updated daily on week days.
Initial download of the metrics may take a while.