Fig. 3.
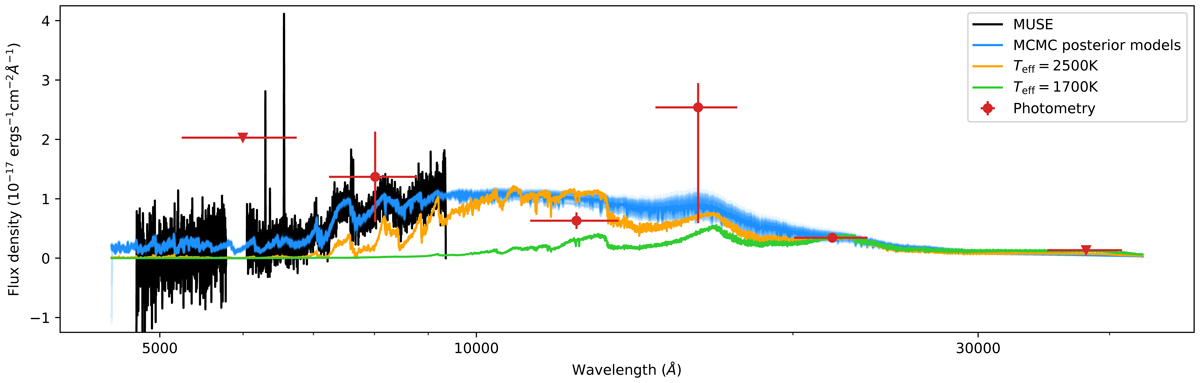
Observations of CS Cha b and the best fit MCMC model. The optical spectrum from MUSE is black while the photometric observations (listed in Table A.1) are shown in red. The vertical bars of the photometric points indicate the uncertainty in the flux and the horizontal bars show the width of the filter that was used. The triangle markers are used for upper limits. The blue lines show 100 random samples from the derived posterior distributions for which median temperature is Teff = 3452 K. A Teff = 2500 K (orange) and Teff = 1700 K (green) model are shown for comparison. The lower temperature models have been scaled to match the K-band photometry. The low temperature models have a significantly lower flux in the optical part compared to the observations.
Current usage metrics show cumulative count of Article Views (full-text article views including HTML views, PDF and ePub downloads, according to the available data) and Abstracts Views on Vision4Press platform.
Data correspond to usage on the plateform after 2015. The current usage metrics is available 48-96 hours after online publication and is updated daily on week days.
Initial download of the metrics may take a while.