Fig. 1.
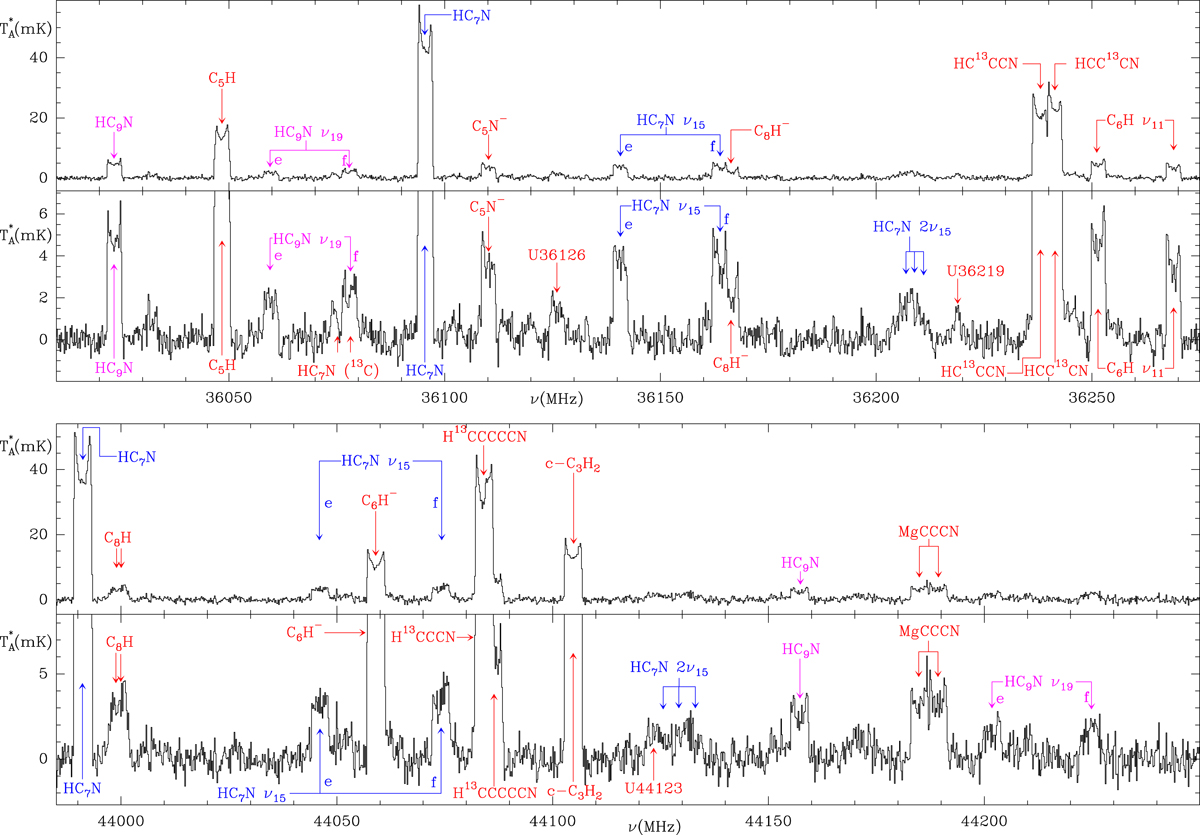
Data from two frequency ranges within the Q-band observed with the Yebes 40 m telescope towards IRC +10216. Each frequency range is shown through two panels with different limits in intensity. The vertical scale is antenna temperature in mK. The horizontal scale is the rest frequency in MHz. Labels for HC7N features are in blue, while those belonging to HC9N are in violet. Other spectral features from known species, together with unidentified lines (labeled as “U” lines), are indicated in red. The N = 16−15 doublet of MgCCCN, a new species recently detected (Cernicharo et al. 2019), is shown in the bottom panels. Vibrationally excited lines from HC7N, HC9N, and C6H are nicely detected at these frequencies. Additional lines from vibrationally excited states of HC5N, HC7N, and HC9N are shown in Figs. 2, A.1, and A.3.
Current usage metrics show cumulative count of Article Views (full-text article views including HTML views, PDF and ePub downloads, according to the available data) and Abstracts Views on Vision4Press platform.
Data correspond to usage on the plateform after 2015. The current usage metrics is available 48-96 hours after online publication and is updated daily on week days.
Initial download of the metrics may take a while.