Fig. 5.
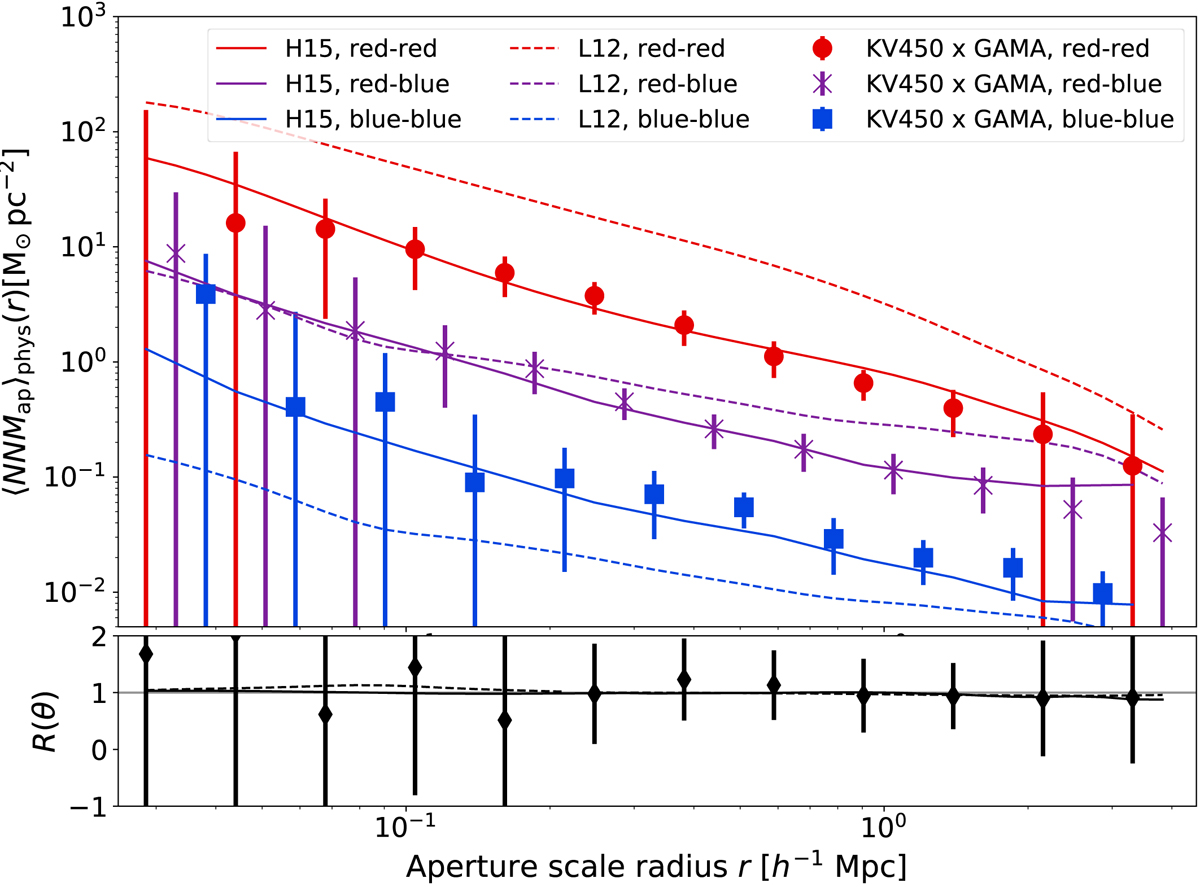
Upper panel: physical aperture statistics for colour-selected lens samples of the H15 galaxies (solid lines), L12 galaxies (dashed lines) and KV450 × GAMA (points). The signal is shown for red–red lens pairs (red lines and filled circles), red–blue lens pairs (purple lines and crosses), and blue–blue lens pairs (blue lines and squares). Error bars on the observational measurements are the standard deviation from jackknifing. Lower panel: ratio statistics R as given by Eq. (25) for the red and blue lens samples of KV450 × GAMA (points), the H15 SAM (solid line) and the L12 SAM (dashed line).
Current usage metrics show cumulative count of Article Views (full-text article views including HTML views, PDF and ePub downloads, according to the available data) and Abstracts Views on Vision4Press platform.
Data correspond to usage on the plateform after 2015. The current usage metrics is available 48-96 hours after online publication and is updated daily on week days.
Initial download of the metrics may take a while.